Chapter 4: The 5-Step approach to Experiment Design
In the previous chapter, we covered empirical research, its core principles, and best practices for two main types of studies. Now, we turn our attention to a key element of empirical work: designing controlled experiments. These experiments are vital in empirical research as they offer a structured method to investigate cause-and-effect, test hypotheses precisely, and collect numerical data in carefully managed settings. This allows researchers to make well-supported conclusions about how specific designs or interventions work, establishing controlled experiments as a fundamental tool across many scientific disciplines, including HCI.
However, designing controlled experiments can be tricky. To illustrate, let's examine the famous Pepsi Challenge: an intriguing case study that reveals both the power and hidden pitfalls of experimental design. While some details of this example have been simplified for clarity, it offers valuable lessons on how delicate and intricate controlled experiments can be.
In the 1970s, Pepsi launched what appeared to be a brilliantly designed experiment to demonstrate consumer preference. The setup seemed flawless: participants were presented with two cups, one labeled 'M' and one labeled 'Q' and the M cup containing Pepsi and the Q cup containing Coca-Cola, and asked to taste both before indicating their preference. The results? A clear majority preferred Pepsi, leading to a massive marketing campaign celebrating this consumer 'victory.'
At first glance, this looks like a perfect controlled experiment:
- Blind taste test eliminating brand bias
- Simple binary choice
- Large sample size across diverse locations
- Standardized procedure
- Statistically significant results
Now, take a moment to think about the following questions:
Ccan you trust the results?
- If not, what could have caused the results to be biased?
If your answer to the first question is yes: what if we told you that subtle changes to the experimental design could dramatically affect the results?
Malcolm Gladwell, in his book 'Blink' ( Gladwell, 2007 ) revealed some fascinating insights about this experiment. For instance, when researchers later conducted similar tests but with different arbitrary labels on the cups (like 'S' vs 'L' instead of 'M' vs 'Q'), the preference patterns shifted significantly. This raised an intriguing question: could something as seemingly insignificant as the letter used to mark the cups have influenced participants' choices?
In fact, experience has shown that our taste perception can be easily influenced by many external factors. For example, in a study by researchers at Caltech and Stanford University showed how price tags can dramatically influence people's perception and enjoyment of wine ( Plassmann et al., 2008 ). In their experiment, participants tasted the same wines multiple times but were told they had different prices. When participants believed they were drinking a $90 bottle of wine, they reported enjoying it significantly more than when they thought the same wine cost only $10. Brain scans using fMRI supported these subjective reports, showing increased activity in the medial orbitofrontal cortex (mOFC) — a region associated with experiencing pleasure — when participants thought they were drinking more expensive wines. In a follow-up blind tasting without price information, participants actually preferred the cheaper wine. ( Note: While this example draws from historical events, some details have been simplified or adapted to illustrate key principles of experimental design. The actual history of the Pepsi Challenge and its methodology is more complex. )
The lesson from these examples is that experimental design in HCI research is no easy task. What may seem like a straightforward experiment — such as the Pepsi Challenge — can be riddled with hidden confounding variables that significantly impact results. Even subtle factors like cup labels or perceived value can dramatically influence human perception and behavior, potentially invalidating what appears to be a well-designed study.
This complexity is precisely why the HCI research community places strong emphasis on detailed methodology reporting. When reading or writing research papers, every aspect of the experimental design must be carefully documented and justified:
To navigate the complexities of experimental design, this chapter introduces a systematic 5-step approach. This framework is designed to help researchers transform initial ideas into well-structured experimental studies. It serves as an accessible starting point for students and researchers new to empirical work, offering a practical guide to initiating controlled experiments. For instructors and mentors, it provides a clear pedagogical structure for teaching fundamental concepts and fostering good research practices from the outset.
It is important to recognize, however, that while this 5-step approach offers a valuable foundation, it does not encompass the full depth of experimental design. Mastering this field requires ongoing learning, deeper methodological knowledge, and extensive hands-on experience beyond the scope of this introductory framework. Its primary aim is to help beginners establish sound research habits.
4.1 An Overview of the 5 Step Approach
In HCI research, we often start with broad questions like "Is my new interface better than existing approaches?" or "Does this interaction technique improve user performance?" While these questions reflect important research goals, they are not directly testable through controlled experiments. The challenge lies in transforming these rough ideas into precise, scientifically validatable hypotheses.
The 5 Step Approach to Experiment Design provides a systematic framework to help researchers bridge this gap between initial research interests and well-structured experimental methodology. This approach breaks down the process into manageable steps that progressively refine and formalize the experimental design:
- Define the research question
This crucial first step transforms a broad research interest into a specific, testable question by carefully defining the target population, tasks, measures, and factors of interest. For example, rather than asking "Is this interface better?", we might ask "Does this interface reduce task completion time for novice users performing specific navigation tasks?"
- Determine variables
Here we identify and operationalize the key variables that need to be measured or controlled. This includes independent variables (what we manipulate), dependent variables (what we measure), and potential confounding variables that need to be controlled.
- Arrange conditions
This step involves structuring how the independent variables will be tested through specific experimental conditions, including important considerations like counterbalancing and participant assignment.
- Decide blocks and trials
The experiment is further organized into blocks and trials to ensure proper experimental control and sufficient statistical power while managing practical constraints.
- Set instruction and procedure
Finally, detailed protocols are established for every aspect of running the experiment, from participant recruitment through to debriefing.
For a deeper understanding of experimental methodology in HCI, readers are encouraged to consult MacKenzie's work ( MacKenzie, 2013 ). The 5 Step Approach presented here serves as an accessible starting framework, helping researchers systematically develop their initial research interests into well-designed controlled experiments.
|
Suggested Reading: " Human-Computer Interaction: An Empirical Research Perspective " |
Let's illustrate this approach through a concrete example. In 2007, researchers, including the author of this book, developed earPod, a novel eyes-free menu selection technique that used touch input and reactive audio feedback ( Zhao et al., 2007 ). While the natural comparison would be with other audio interfaces like Interactive Voice Response (IVR) systems, the researchers took on a more ambitious challenge. Rather than simply showing improvement over IVR systems, which were known to perform poorly, they wanted to challenge the long-held assumption that audio interfaces could not compete with visual ones. They believed that earPod's careful design could potentially match the performance of visual menus like those used in iPods — an intriguing proposition that required empirical validation.
This scenario presents a classic HCI research challenge: how do we systematically evaluate and compare a new interaction technique with existing approaches? The researchers couldn't simply rely on intuition or informal testing — they needed a rigorous experimental methodology to understand how earPod compared against the established iPod-style visual menu interface, without assuming one would necessarily be better than the other.
A Note on Selecting a Baseline for Comparison
Before embarking on the 5 Step Approach, a crucial preliminary decision is selecting an appropriate "baseline"—the existing technique or system against which your new approach will be compared. This choice is fundamental, as it significantly influences the research direction and the interpretation of your findings. While this chapter details the experimental process after a baseline is chosen, its selection is a non-trivial task.
For introductory purposes, consider two common strategies:
- Compare against a State-of-the-Art (SOTA) approach: Benchmark against the most advanced or highest-performing current solution addressing the same problem . This helps demonstrate genuine innovation.
- Compare against the most Popular or Widely Used approach: Evaluate against the incumbent solution familiar to most users. This is key for showing practical relevance and potential for real-world adoption.
The ideal baseline often depends on specific research goals — whether aiming for theoretical advancement, practical applicability, or a combination. This foundational decision frames how your experimental results are understood.
The 5 Step Approach provides a systematic framework for transforming such research goals into well-structured experiments. Let's see how this approach helped guide the experimental design process for evaluating earPod. We'll use this example throughout the chapter to illustrate each step in detail.
4.2 Step 1: Define the research question
"Defining the research question" can be broken down into 5 substeps:
Step 1.1 Start with a general question
An example of a general question would be: How does earPod compare with iPod’s menu in terms of performance?
Once you have a general question, you can then refine it into a more specific, testable question. This refinement process involves narrowing down broad concepts into concrete, measurable elements.
For example, the general question "How does earPod compare with iPod's menu in terms of performance?" is too broad to test directly. We need to specify exactly what aspects of performance we're measuring, with which users, doing what tasks, and under what conditions.
In the context of HCI, this refinement process can be guided using the following template:
(Your solution/product/service) is better than (other solutions/products/services) for (what target population Step 1.2) in (what tasks Step 1.3) under (what contexts Step 1.5) based on (what measurable terms Step 1.4).
Applying this template to our earPod example, the broad question transforms into something more specific like: "Does the earPod menu selection technique result in faster task completion times compared to iPod's visual menu when used by young adults (18-30 years) performing hierarchical menu navigation tasks while walking?"
This refined question is now more testable because it specifies:
- The exact comparison (earPod vs iPod visual menu)
- The target users (young adults 18-30)
- The specific task (hierarchical menu navigation)
- The context (while walking)
- The measure (task completion time)
Now you have an understanding of the overall approach, let's go through each substep in detail.
Step 1.2 Define target population
Defining the target population is an important step in the product development process as it helps to ensure that the product is designed to meet the specific needs and preferences of the intended users.
In this case, if the target population for the earPods is young people, then it's important to further define this group based on factors such as age range, gender, and other relevant characteristics.
By defining the target population more precisely, the research/product development team can ensure that the earPods are designed with the specific needs and preferences of this group in mind. This can help to increase the product's appeal and usability among the target population, ultimately leading to greater success in the market.
Step 1.3 Define tasks
Step 1.3 involves defining specific experimental tasks that will help achieve the research objectives. For menu selection interfaces like in our example, tasks can range from selecting items in a short one-level menu to navigating complex hierarchical menu structures.
Given the potentially vast number of task variations - considering different menu lengths, depths, and structures — it's typically impractical to test every possible scenario. Instead, researchers must thoughtfully select a representative subset of tasks. This selection should be guided by understanding how the target users will interact with the system in real-world contexts.
In addition, menu content itself requires careful consideration to ensure fair comparisons between conditions. For instance, if certain menu items are inherently more difficult to select than others, this could introduce unwanted bias into the results. The goal is to create balanced task sets that allow meaningful comparison while controlling for confounding variables.
The key considerations when defining tasks include:
- Identifying core tasks representative of real system usage
- Selecting an appropriate subset that balances thoroughness with practical constraints
- Ensuring tasks directly address the research questions
- Accounting for task characteristics like complexity, familiarity, and frequency of use
By the end of this step, you should have:
- A clear definition of participant tasks
- Strong rationale for task selection
- Clear connection between tasks and research objectives
While task design can be challenging due to the many potential sources of bias, reviewing existing literature can provide valuable guidance. Tasks that have been successfully used in similar studies often serve as good starting points for new experiments.
Step 1.4 Define measures
This step involves defining the measures that will be used to evaluate the performance of the system being tested. In the example provided, the general question is how does earPod compare with iPod's menu in terms of performance. However, performance is a broad concept that needs to be operationalized to be testable.
In traditional HCI research, several key measures have been established to evaluate system performance ( Nielsen & Phillips, 1993 ) . The most commonly used measures include:
- Speed/Efficiency: Measures how quickly users can complete tasks, typically through metrics like task completion time, actions per minute, or time between actions ( Card et al., 1983 ). For example, in text entry studies, words per minute (WPM) is a standard speed metric.
- Accuracy/Error Rate: Quantifies how precisely users can complete tasks without mistakes. This can be measured through error counts, error rates, or task success rates ( Soukoreff & MacKenzie, 2003 ). For instance, in target selection tasks, accuracy might be measured as distance from target or selection error percentage.
- Learnability: Assesses how easily users can become proficient with a system. This is often measured through learning curves showing performance improvement over time, time to reach expert performance, or retention of skills after periods of non-use ( Grossman et al., 2009 ).
- User Satisfaction: While more subjective, satisfaction has become increasingly important and is typically measured through standardized questionnaires like SUS (System Usability Scale) or custom Likert-scale ratings ( Brooke, 1996 ).
- Cognitive Load: Measures the mental effort required to use a system, often assessed through techniques like NASA-TLX or dual-task performance ( Hart & Staveland, 1988 ).
These measures are often used in combination to provide a comprehensive evaluation of system performance and usability. While these traditional metrics have proven effective for many conventional interfaces, the evolving landscape of HCI continues to demand new and more sophisticated measurement approaches.
This is particularly evident in the emergence of AI-powered interactive systems, which has introduced significant challenges in developing appropriate evaluation metrics. While traditional usability evaluation frameworks like the System Usability Scale (SUS), User Experience Questionnaire (UEQ), and NASA Task Load Index (NASA-TLX) have served well for conventional systems, they fall short in capturing the complex dynamics of human-AI interaction. As AI systems become increasingly sophisticated with context-awareness and real-time response capabilities, researchers must consider new dimensions such as trust, emotional engagement, and ethical implications. This has led to active research in developing new evaluation frameworks that can adequately assess these emerging aspects of human-AI interaction, while also addressing the practical challenges researchers face in selecting and combining appropriate metrics for comprehensive system evaluation ( Zheng et al., 2025 ).
Regardless of whether using traditional or emerging measures, it remains crucial to specify exactly what will be measured and how the measurement will be conducted. For example, if speed is being measured, researchers must clearly define the specific task being timed, the starting and stopping points of the timer, and any rules for completing the task. This level of detail ensures that measurements can be replicated and results can be meaningfully compared across studies.
Through careful selection and precise definition of measures, researchers can ensure their evaluation is objective and consistent, ultimately enabling meaningful analysis and comparison of results across different studies and contexts.
Step 1.5 Define additional factors
Beyond the core experimental elements of techniques, target users, tasks, and measures, researchers must carefully consider additional factors that can influence results. These factors encompass a wide spectrum, from environmental conditions like lighting, temperature, and ambient noise, to technical aspects such as device performance and network connectivity. Participant-related factors including physical and mental fatigue, motivation levels, and prior experience can significantly impact outcomes. The social and contextual landscape, including the presence of others, cultural considerations, and concurrent activities, adds another layer of complexity to experimental design.
While it would be impractical to manipulate or control for every possible factor, researchers must make informed decisions about which additional factors warrant inclusion. This selection process should be systematically guided by several key principles.
- First, there should be theoretical or empirical evidence suggesting the factor could meaningfully impact results
- Second, the factor should have direct relevance to real-world usage scenarios of the system under study
- Third, it must be feasible to properly control and measure the factor within practical study constraints
- Finally, the factor should have potential to yield actionable insights that advance understanding of the research questions
Consider, for instance, the evaluation of a wearable device intended for mobile use. In this context, movement patterns become crucial - how users walk, their typical pace, and their gait characteristics can significantly influence interaction. Environmental conditions such as transitioning between indoor and outdoor spaces or varying lighting conditions may affect device usability. The way users position and interact with the device, combined with their physical capabilities and cognitive load while multitasking, creates a complex web of interacting factors that must be carefully considered.
The ultimate goal is to strike a delicate balance between experimental control and ecological validity. Through thoughtful selection and control of additional factors, researchers can produce findings that maintain scientific rigor while remaining applicable to real-world scenarios. This requires careful consideration of which factors are most likely to meaningfully impact the research questions while remaining manageable within the study's practical constraints. The resulting experimental design should enable the collection of data that is both statistically sound and practically relevant, advancing our understanding of human-computer interaction in meaningful ways.
Let's explore how to convert general research questions into detailed experimental designs through two practical examples. We'll walk through this process step by step to help you understand how to apply these concepts in your own research.
Example 1: EarPods vs iPod
Having covered the key principles and considerations for experimental design, let's examine how to apply these concepts through concrete examples. Based on the research work we reviewed earlier about the EarPod, let's explore how we can design a controlled experiment to fairly compare it with the iPod's linear menu.
🤔 Exercise: Designing an EarPod vs iPod Experiment
Let's design an experiment to compare EarPod and iPod's menu systems. Before looking at the solution, try answering these questions:
- General Question: This is straightforward - we need to ask how our new technique compares with an existing technique (often called the baseline) in terms of performance. When we apply this general approach to our specific context, the question becomes:
- How does the EarPod's radial menu compare with iPod's linear menu in terms of performance?
However, this general research question is not directly testable as it is too vague. To transform it into a testable experimental question, we need to specify exact test conditions, settings, measurements, and metrics. Let's examine each of these components based on the prompting questions below.
- Target Population:
- Who would be most likely to use and benefit from this technology?
- What age range would be most appropriate and why?
- What prior experience should participants have?
- Tasks:
- The task involves menu selection, which has many possible combinations
- When selecting representative tasks, consider these key questions:
- What are the key dimensions that define your task space?
- How can you systematically categorize tasks along these dimensions?
- What proportion of tasks should come from each category?
- Which scenarios are most critical to test?
- Measures:
- What metrics would best capture user performance?
- Other Factors:
- What real-world conditions might affect performance?
- What variables should we control for?
💡 Sample Solution:
-
General Question:
"How does earPod compare to iPod's menu in terms of performance?"
-
Target Population:
Young people (who are typically early adopters of new technology) Reason: This group tends to be more receptive to new interaction methods and represents likely early adopters
-
Tasks:
Menu selection with controlled variables:
- Breadth: 4, 8, and 12 items
- Depth: 1 and 2 levels Reason: This range tests both simple and complex menu structures while remaining realistic. The trend observed from different breadth and level 1 to 2 can help predict performance patterns for even deeper menu hierarchies
- Measures:
- Speed: Time to complete selections
- Accuracy: Error rates in selection
- Learnability: Performance improvement over time Reason: These metrics represent traditional HCI evaluation measures (this study was conducted in 2007). Today, researchers might also consider additional metrics like cognitive load, user satisfaction, emotional response, or physiological measures (e.g., eye tracking, EEG) to gain deeper insights into the user experience
- Other Factors:
- Single task vs Multitasking scenarios
- Device footprint size (small - watch, medium - mobile phone, large - tablet) Reason: These factors reflect real-world usage conditions and help ensure ecological validity
Note: The specific factors, measures, and tasks chosen above represent just one possible experimental design. The key is having clear logical reasoning behind each choice that aligns with your research goals. For example:
- If your research focused more on accessibility, you might choose a different target population like older adults or users with motor impairments
- If investigating social contexts was important, you might add tasks involving group settings or public vs private usage
- If environmental robustness mattered most, you might test in more extreme conditions like rain or bright sunlight
The choices should flow from your specific research questions and hypotheses. What's most important is explicitly stating your reasoning and ensuring all components work together cohesively to address your core research goals.
Example 2: Wearable Interactive Rings
Let's consider another example to further illustrate this process. This time, we'll delve into designing an experiment for a wearable device.
Sarah, a PhD student at a leading HCI lab, was working on an exciting new project developing smart rings for notifications. Her advisor had challenged her to figure out the best way for these rings to alert users.
"There are so many ways we could notify someone wearing a smart ring," Sarah thought to herself as she sketched in her research notebook. She listed out the possibilities: a subtle glow from embedded LEDs, a gentle chime or beep, a slight vibration against the finger, a small mechanical tap, and even a gradual warming sensation.
As she planned her research investigation, Sarah remembered the structured approach she had learned in her HCI methods class. First, she needed to clearly define what she was trying to learn — in this case, determining the most effective notification method for these wearable rings. Then she had to carefully analyze her options, categorizing them into immediate feedback methods (like the light, sound, vibration and physical poke) versus gradual feedback (like the thermal change).
Now came the challenging part — designing a proper investigation that would give her meaningful results. Sarah pulled out her experimental design template and began to think through the components...
Exercise: Designing a Smart Ring Notification Experiment
Let's design an experiment to evaluate different notification methods for smart rings. Before looking at the solution, try answering these questions:
- General Question: "Which ring notification method is most effective for timely alerts?"
- Target Population:
- Who are the intended users of smart ring notifications?
- What demographics might have different notification needs?
- What prior experience with wearable technology is relevant?
- Tasks:
- What tasks would test users' ability to receive basic notifications?
- What tasks could evaluate users' responses to different notification priorities?
- Measures:
- How do we quantify notification effectiveness?
- What metrics would capture both performance and user experience?
- How can we measure real-world usability?
- Other Factors:
- What environmental conditions might affect notification perception? (noise, lighting, temperature)
- What temporal factors should we consider? (time of day, duration of use)
- How might different contexts impact effectiveness? (social settings, work vs leisure)
- What physical states of users should we account for? (fatigue, stress level, alertness)
💡 Sample Solution:
-
General Question:
"Which ring notification method is most effective for timely alerts?"
-
Target Population:
General technology users (broad demographic) Reason: Smart rings are intended for mainstream use, so testing with a diverse population helps ensure broad applicability
- Tasks:
- When notification occurs, participants must:
- Acknowledge receipt by tapping the ring once
- Classify urgency (high/low) by number of taps (double/single) Reason: These tasks simulate real-world notification scenarios while providing measurable responses
- Measures:
- Reaction Time: From notification to response
- Error Rate: Percentage of missed notifications
- User Preference: Subjective ratings of each method Reason: These metrics capture both objective performance and subjective experience, which are crucial for wearable notifications
- Other Factors:
- Activities in which notification is received
- Lying down
- Sitting
- Standing
- Walking
- Running Reason: These contextual factors could significantly impact notification effectiveness and user receptiveness. We need to carefully consider which factors to systematically manipulate as independent variables (e.g., activity type). Also, to avoid comfounding variables, we also need to determine what factors to control for (e.g., time of day, environmental conditions) in our experimental design.
4.2.1 Step 1 Summary & Your Turn
In summary, Step 1, "Formulate Research Question and Hypothesis," is about clearly defining the core elements of your study. This foundational step involves:
- Articulating a clear General Question that your experiment aims to answer.
- Identifying the specific Target Population you intend to study.
- Designing relevant Tasks that participants will perform.
- Selecting appropriate Measures to quantify outcomes and user experience.
- Considering Other Factors (environmental, temporal, contextual, or user-related) that might influence your results and need to be either controlled or systematically varied.
The template and two example studies above illustrate how to structure these initial thoughts.
Now, it's your turn! Before moving on, take a moment to think about a research idea or a problem you'd like to investigate. Using the five components discussed (General Question, Target Population, Tasks, Measures, Other Factors), try to sketch out an initial design for your own study. This exercise will help solidify your understanding of these fundamental concepts and prepare you for the next crucial step: determining your variables.
4.3 Step 2: Determine Variables
After formulating a clear research question and hypothesis, the next crucial step in experimental design is defining the variables that will be measured and manipulated. Variables are the building blocks of any experiment — they are the factors that can change or vary during the study. Understanding and carefully defining these variables is essential because they determine what we can measure, control, and ultimately conclude from our experimental results. In experimental design, we typically work with several types of variables, each serving a distinct purpose in helping us test our hypothesis and ensure the validity of our findings.
The four common variables to consider are independent variables (IV), dependent variables (DV), control variables, and random variables (See Figure 4.1 ).
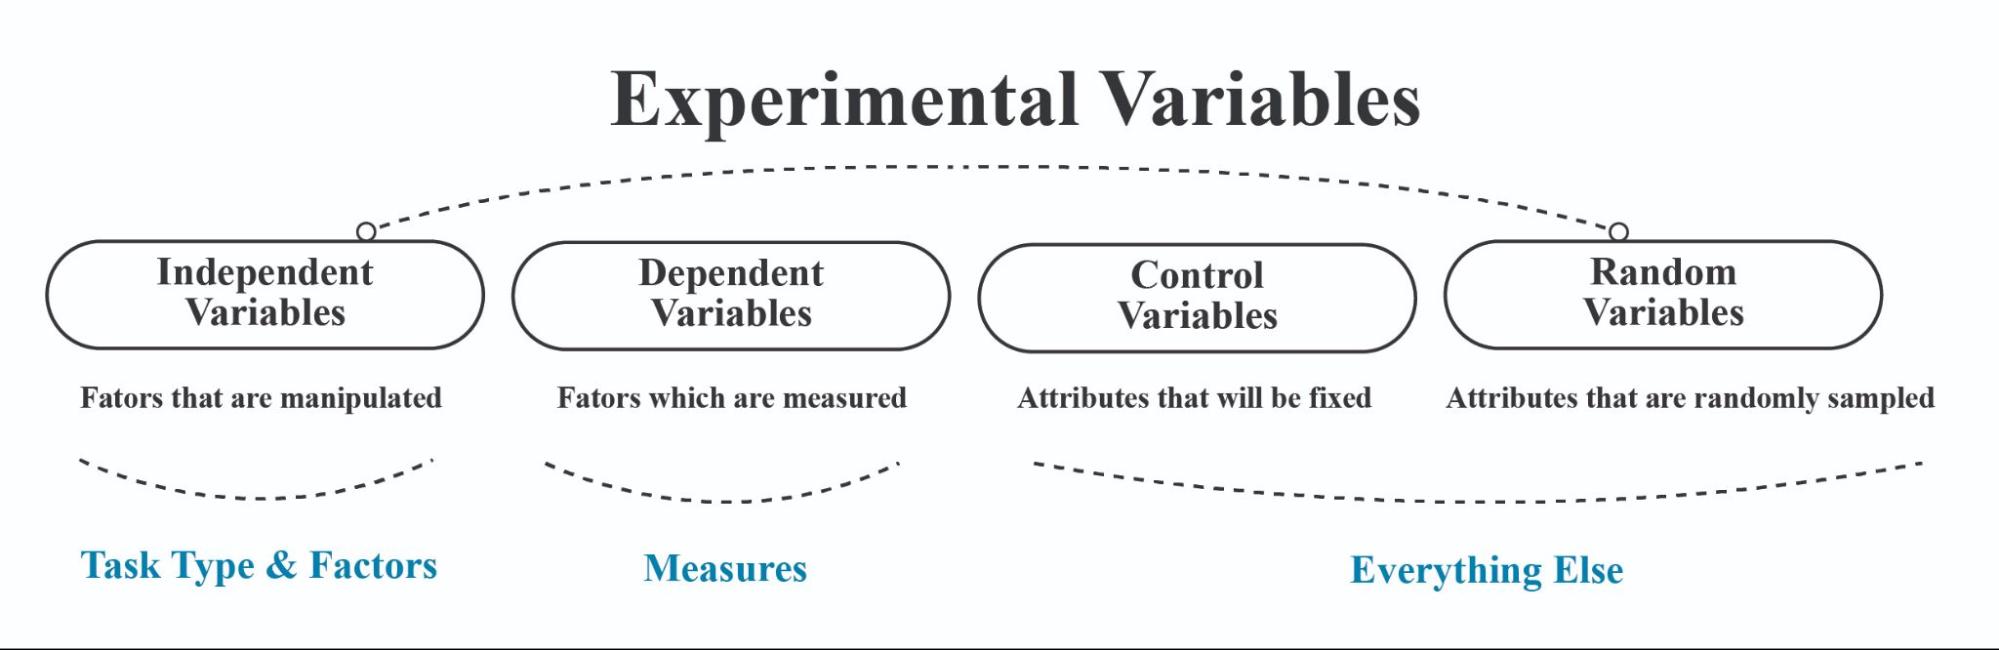
Figure 4.1 Diagram summarizing four fundamental types of variables used in experimental research
- Independent variable (IV)
- A factor that is manipulated in the experiment, and it has multiple levels. It is the variable that we are interested in studying, and we want to see how it affects the dependent variable. There are two types of IVs: primary and secondary, which we elaborate more in the next section.
- Dependent variable (DV)
- A factor that is being measured in the experiment, and it is influenced by the independent variable.
- Control variable (CV)
- The attribute that is fixed throughout the experiment to eliminate other factors that could affect the results.
- Random variable (RV)
- The attribute that is randomly sampled to increase generalizability.
Let's examine how to map different components of our experimental design into appropriate variables:
Mapping Research Components to Variables:
- Independent Variables (IV):
- Primary techniques being compared (e.g., earPod vs. iPod or notification methods)
- Task types or conditions (e.g., different scenarios of usage single-task vs. multi-task or activity types like sitting vs. walking)
- Key factors from "Other Factors" that we actively manipulate (e.g., different environmental conditions)
- Dependent Variables (DV):
- Our measurement metrics (e.g., reaction time, error rate)
- User performance indicators (e.g., accuracy, completion time)
- Subjective measures (e.g., user preference ratings)
- Control Variables (CV):
- Environmental factors we keep constant (e.g., room temperature)
- Equipment settings (e.g., same testing hardware across participants or notification intensity)
- Procedural elements (e.g., instruction delivery method)
- Random Variables (RV):
- Participant demographics (e.g., age, gender)
- Individual differences (e.g., prior experience)
- Natural variations in participant state (e.g., alertness level)
This mapping ensures we properly categorize and account for all relevant factors in our experimental design.
Note: Distinguishing between primary and secondary Independent variables
The primary independent variable (IV) in an experiment is the most important factor being investigated and helps answer the primary research question. The secondary IV is an additional factor that is also manipulated to provide more information on the primary research question.
For example, in a study on the effects of interface design on task completion time, the primary IV might be the type of interface design (e.g. menu-based vs. icon-based), while the secondary IV could be the experience level of the participants (e.g. novice vs. expert users). By including the secondary IV, we can investigate whether the effect of interface design on task completion time is different for novice and expert users.
In another study, the primary IV might be the presence or absence of feedback in a virtual reality system, while the secondary IV could be usage scenarios (e.g. office work vs. entertainment settings). By including the secondary IV, we can investigate whether the effect of feedback on task performance is different for different usage scenarios.
Overall, the distinction between primary and secondary independent variables is important because it has implications for the experimental setup. Primary independent variables often need to go through the most strict experimental setup. For example, they need to be well counterbalanced in a within-subject controlled experiment design. For some secondary independent variables, sometimes they don't need to be strictly counterbalanced if we don't primarily care about how the different levels within that secondary variable compare to each other, but rather, we only care about how it affects the primary IV (more on these topics in the explanation of Step 3: Arrange conditions below).
Note: Confounding variables
At this stage of the experimental design, our goal is to check how these factors affect the performance of these measures in a given task. But how do we know these factors are the only factors influencing the condition?
We need to be careful about confounding variables, which are extraneous variables that can affect the variables being studied and produce misleading results. Any variable, other than the independent variables, that could plausibly explain changes in measures may be deemed a confounding variable. To illustrate, consider two scenarios:
In Case 1, where three techniques (A, B, C) are compared sequentially, the improvement in performance may be attributed to practice, rendering "Practice" a confounding variable.
Similarly, in Case 2, comparing search engine interfaces (Google vs. New Search Interface), the prior experience of participants with Google becomes a confounding variable if it influences their performance.
Practice and prior experience are just two examples of confounding variables that necessitate careful consideration and control in experimental design. Mitigating these factors, as elaborated in the subsequent section on Arranging Conditions through techniques such as Counterbalancing (refer to section 4.4), is imperative for ensuring the integrity of experimental outcomes.
To put things in perspective, let’s draw on some examples of confounding variables.
Let us now practice determining variables in our experiment design using the similar examples from before.
|
Example 1: Earpods vs ipod |
Example 2: Smart Ring Feedback & Activity |
|
Example 1: Earpods vs iPod |
Example 2: Smart Ring Feedback & Activity |
|
:--------------------------- |
:--------------------------------------------- |
|
Independent Variables (IV) |
Independent Variables (IV) |
|
Variable | Level 1 | Level 2 | Level 3 |
Variable | Level 1 | Level 2 | Level 3 |
|
Technique | earPod | iPod | - |
Feedback Type | Light | Audio | Vibration |
|
Usage Scenario | single-task | dual-task | - |
Physical Activity | Lying Down | Sit | Walk |
|
Menu Breadth | 4 | 8 | 12 |
|
|
Menu Depth | 1 | 2 | - |
|
|
Dependent Variables (DV) |
Dependent Variables (DV) |
|
Variable | Measurement |
Variable | Measurement |
|
Speed | completion time |
Response Time | Time to react to feedback (s) |
|
Accuracy | percentage of errors |
Identification Accuracy | % correctly identified feedback |
|
Learning | speed & accuracy change over time |
Learning | Change in response time/accuracy over trials |
|
Control Variables (CV) |
Control Variables (CV) |
|
- Same computer |
- Same smart ring model & software |
|
- Same experiment time |
- Standardized feedback intensity/duration |
|
- Same environment |
- Controlled ambient environment (e.g., noise, light) |
|
- Same instructions provided |
- Standardized task for evaluating feedback |
|
Random Variables (RV) |
Random Variables (RV) |
|
Participant attributes: |
Participant attributes: |
|
- Age |
- Age, Gender |
|
- Gender |
- Sensory acuity (tactile, auditory) |
|
- Background |
- Prior experience with wearables |
4.4 Step 3: Deciding the type of experiment and arrange conditions
After identifying and mapping our experimental variables, the next crucial step is to determine the type of experiment and how to structure and arrange our experimental conditions. Before diving into the specific steps of arrangement, let's understand the type of experiments, what we mean by experimental conditions, and why their careful design (such as counterbalancing) is essential.
Type of experiments: Within-subject design and between-subject design are two fundamental approaches to experimental research (see Figure 4.2 ), with mixed design combining elements of both:
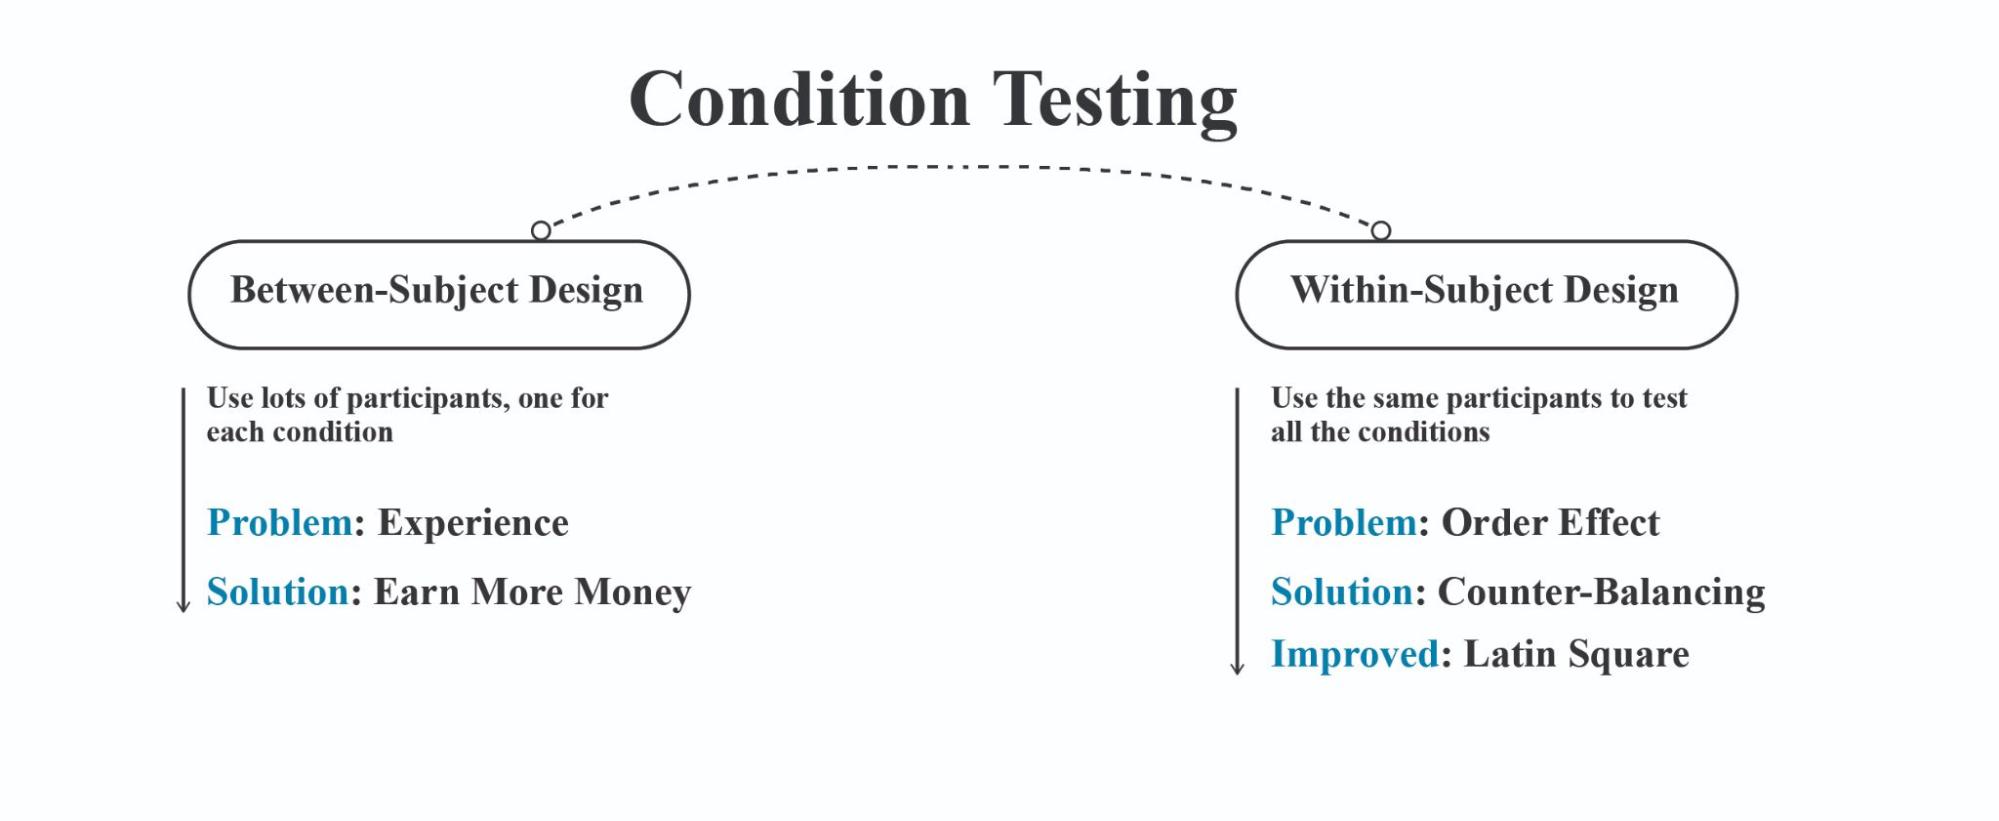
Figure 4.2 Diagram illustrating the differences between between-subject and within-subject experimental designs.
Within-subject design (also called repeated measures) has participants experience all experimental conditions. Each participant serves as their own control, which reduces individual differences as a source of error variance. This approach requires fewer participants and can be more statistically powerful. However, it may introduce order effects (fatigue, practice, carryover) that need to be controlled through counterbalancing or randomization.
Example : In a study testing three different user interfaces, the same 20 participants use all three interfaces and complete tasks on each. The order of interfaces is counterbalanced across participants.
Between-subject design assigns different participants to different experimental conditions, with each participant experiencing only one condition. This eliminates order effects but requires larger sample sizes to account for individual differences. It's typically simpler to implement but may have less statistical power compared to within-subject designs.
Example : To test three different user interfaces, 60 participants are randomly assigned to three groups of 20. Group A uses only Interface 1, Group B uses only Interface 2, and Group C uses only Interface 3.
Mixed design (also called split-plot design) combines both approaches by having at least one within-subject factor and at least one between-subject factor. This allows researchers to examine interactions between factors that can't all be tested within subjects.
Example : Testing the effectiveness of three user interfaces (within-subject factor) across two age groups (between-subject factor). 40 participants (20 young, 20 older adults) each test all three interfaces. The analysis examines both the main effects of interface design and age group, plus potential interactions between these factors.
The choice between these designs depends on research questions, practical constraints, and the nature of what's being studied.
Experimental condition: An experimental condition represents a specific combination of independent variable levels that participants will experience during the study. The way we arrange these conditions can significantly impact the validity of our results. For instance, if we're studying the impact of different interface designs on user performance, each unique combination of interface elements would constitute a distinct experimental condition. The order and manner in which participants experience these conditions need to be carefully controlled to ensure reliable results.
The arrangement of conditions involves several key considerations: how many participants we need, how to sequence the conditions, and how to control for potential learning or fatigue effects. These decisions will ultimately shape the robustness of our experimental design and the reliability of our findings.
We will focus on arranging conditions for within-subject factors — where participants experience all levels of the independent variable. This design is preferred as it is more economical and offers better statistical power compared to between-subject design. However, since participants experience multiple conditions, we must carefully control for learning effects and fatigue through proper arrangement of conditions.
Between-subject factors require less attention in condition arrangement since each participant experiences only one level of these variables, eliminating concerns about order effects within these factors. Our focus remains on within-subject factors where order effects pose significant challenges.
For mixed designs, which combine both approaches, we primarily need to manage the ordering of the within-subject portions. The between-subject component is handled through random assignment to groups before any testing begins.
Counter Balancing: To control for order effects, researchers can use counterbalancing . This involves presenting the conditions in different orders for different participants to cancel out the order effect. For example, if we assume the order effect is symmetric and linear, we can present the conditions in the order of A followed by B and B followed by A, and counter-balance the order across participants.
How do we counterbalance and number of participants needed?
Fully counter-balancing
means that each condition appears an equal number of times across all possible orders of presentation. It is easy to counterbalance an IV with 2 levels. To counterbalance 3 levels with the same assumptions, i.e. assume that effects are symmetric, and equal in size, we need to counter-balance as follows:
P1: A B C
P2: A C B
P3: B A C
P4: B C A
P5: C A B
P6: C B A
If we have four levels of an independent variable (A, B, C, and D), and we want to fully counterbalanced, we would need 4x3x2=24 participants to test all possible combinations of levels. Similarly, if we have five levels of an independent variable (A, B, C, D, and E), we would need 5x4x3x2=120 participants to fully counter-balance.
To take another example: A study compares earPod and iPod techniques in single-task and multi-task scenarios with two levels of menu depth. The minimum number of participants needed is four, and the counter-balancing strategies chosen are fully counter-balancing for technique and scenario of use, and no counter-balancing for menu depth. If menu depth is fully counter-balanced, eight participants would be needed. If technique has three levels and is fully counter-balanced, either 12 or 24 participants would be needed depending on whether menu depth is counter-balanced.
Fully counter-balancing can be time-consuming and impractical, especially when we have many independent variables with multiple levels. In such cases, we can use partial counterbalancing techniques, such as Latin square, which ensure that each level appears in every position equally often, but not all possible orders are tested.
Latin square
is a method of partial counterbalancing that is used to control order effects when there are more than two levels in an independent variable. In a Latin square, each level (A, B, C) appears once in each position (first, second, third) across the conditions. So, in this case, we have three conditions (A, B, C) and each participant would be tested in one of these conditions, but the order of presentation would be different for each participant based on the Latin square:
A B C
B C A
C A B
Using a Latin square reduces the number of participants needed to control for order effects compared to full counterbalancing. For example, if we have four levels in an independent variable, using a Latin square would require 4 participants instead of 24 needed for full counterbalancing.
Steps to arrange the conditions for within subject design:
Step 3.1 listing all (within-subject) independent variables and their levels. In the example given, there are three (within-subject) independent variables: technique (earPod vs. iPod), scenario of use (single-task vs. multi-task), and menu depth (1 vs. 2).
Step 3.2 deciding on a counter-balancing strategy for each independent variable. Counterbalancing is a technique used to control for order effects in within-subject designs. The three strategies listed in the example are fully counter-balancing, Latin-square, and no counter-balancing (sequential). The choice of strategy depends on the researcher's interest in the independent variable.
Step 3.3 determining the minimum number of participants needed for the study. The minimum number of participants is calculated based on the number of levels of each independent variable and the counter-balancing strategy chosen. In the example, the minimum number of participants needed is 4 (2 technique conditions x 2 scenario conditions x 1 menu depth arrangement).
Step 3.4 arranging the overall design of the study based on the counter-balancing strategies chosen. In the example, the technique and scenario of use variables are fully counter-balanced, while the menu depth variable is not counter-balanced and is arranged sequentially.
Step 3.5 determining the detailed arrangement for each participant. This involves assigning participants to each condition in a systematic way based on the counter-balancing strategies chosen.
Let's walk through a practical example to understand how to arrange experimental conditions. We'll use a study comparing earPod and iPod devices.
Step 3.1: First, let's identify what we're testing (our independent variables):
- Device type: earPod vs. iPod
- Usage context: single-task vs. multi-task scenarios
- Menu structure: two different menu depths
Step 3.2: Next, we decide on counterbalancing strategies for each variable:
- Device type: We'll use full counterbalancing to test both orders (earPod→iPod and iPod→earPod) since comparing devices is our main focus
- Usage context: We'll also fully counterbalance scenarios (single-task→multi-task and multi-task→single-task) to control for order effects
- Menu structure: We'll use no counterbalancing and always test depth-1 before depth-2 to simplify the design
Step 3.3: How many participants do we need? Basic setup: We need 4 participants minimum because:
- We have 2 possible orders for device type
- 2 possible orders for usage context
- Only 1 order for menu depth So: 2 × 2 × 1 = 4 participants
Let's consider some different variable setups or counterbalancing strategies and see how these changes affect the overall experimental arrangement.
If we wanted to test menu depth in both orders too:
- This would require 8 participants (2 × 2 × 2 = 8)
If we added a third device to test:
- We'd need 12 participants because:
- With 3 devices, there are 6 possible device orders (3 x 2 x 1 = 6)
- We still have 2 possible scenario orders (single-task→multi-task and multi-task→single-task)
- So: 6 device orders × 2 scenario orders = 12 participants needed
Step 3.4: Let's organize our testing plan in detail:
First, let's clearly identify how we'll refer to our variables and their levels:
Devices (T):
- T1: earPod
- T2: iPod We'll fully counterbalance this, so we'll test both T1→T2 and T2→T1 orders
Scenarios (S):
- S1: single-task scenario
- S2: multi-task scenario We'll fully counterbalance this too, testing both S1→S2 and S2→S1 orders
Menu depth (D):
- D1: depth-1 menus
- D2: depth-2 menus We won't counterbalance this - always testing D1 before D2
By combining these variables and their possible orders, we get 4 distinct testing sequences:
Sequence 1: (earPod first, single-task first)
- T1→T2 (earPod→iPod)
- S1→S2 (single→multi-task)
- D1→D2 (depth-1→depth-2)
Sequence 2: (earPod first, multi-task first)
- T1→T2 (earPod→iPod)
- S2→S1 (multi→single-task)
- D1→D2 (depth-1→depth-2)
Sequence 3: (iPod first, single-task first)
- T2→T1 (iPod→earPod)
- S1→S2 (single→multi-task)
- D1→D2 (depth-1→depth-2)
Sequence 4: (iPod first, multi-task first)
- T2→T1 (iPod→earPod)
- S2→S1 (multi→single-task)
- D1→D2 (depth-1→depth-2)
Each participant will be randomly assigned to one of these four sequences, ensuring we have an equal number of participants for each sequence.
Step 3.5: Detailed Testing Sequence for Each Participant:
Now, let's assign one participant to each testing sequence to see how this plays out in practice. Each participant will follow their assigned sequence exactly, giving us the following detailed testing plans:
Participant 1:
- Tests earPod then iPod
- For each device: does single-task then multi-task
- Always tests menu depth-1 before depth-2
Participant 2:
- Tests earPod then iPod
- For each device: does multi-task then single-task
- Always tests menu depth-1 before depth-2
Participant 3:
- Tests iPod then earPod
- For each device: does single-task then multi-task
- Always tests menu depth-1 before depth-2
Participant 4:
- Tests iPod then earPod
- For each device: does multi-task then single-task
- Always tests menu depth-1 before depth-2
Consider this challenge: What if we expanded our design to include:
- Three levels of technique: earPod, iPod, and nosePod
- Three levels of task complexity: single-task, simple dual-task, and complex dual-task
How would you arrange the testing sequences? Consider:
- How many total conditions would this create?
- How many possible orders exist for each factor?
- What would be the total number of possible sequences?
- How might you make this manageable while still maintaining experimental validity?
Take a moment to work through these questions and sketch out a potential testing plan.
Note: Limitations of counterbalancing
The limitations of counter-balancing as a technique for controlling order effects in within-subject designs. Counter-balancing assumes that the transfer effects between conditions are symmetric and that the increments between conditions are linear. However, if there are asymmetric transfer effects or non-linear increments, then counter-balancing may not work and a between-subjects design may be more appropriate. Additionally, some factors, such as age or gender, may have to be between-subjects factors regardless of the design. For Between-subject Design, there is no need for counterbalancing. Simply assign different users to different conditions!
Note: Strategies for reducing the number of conditions
In many research scenarios, numerous factors may be pertinent to the research question, yet testing them all may be impractical. One effective strategy involves testing only a subset of independent variables initially and then incorporating those demonstrating a significant effect into subsequent studies. Another approach is to exclude certain variables from a counterbalanced design if the absolute difference between their levels is not a focal point of interest. For instance, consider variables such as menu breadth and menu depth in a study comparing interface techniques. While these factors may influence the time taken for selection, they might not be directly relevant to the primary research question. In this context, menu breadth and depth can be considered secondary independent variables. The order of the levels may not significantly impact the comparison between techniques A and B. Thus, by excluding them from the counterbalanced design, researchers can streamline the experimental conditions without compromising the integrity of the study's primary objectives.
Here are some examples to illustrate the strategies for reducing the number of conditions:
Example: Usability testing for a new e-commerce website
Assume there are several potential factors that could affect the usability of the website, including layout, color scheme, font size, and the presence of social media links. To reduce the number of conditions, the researcher may choose to
test only two or three of these factors
at a time, such as layout and color scheme, and then include the other factors in future studies if necessary.
4.5. Step 4: Decide blocks and repetitions
Having determined the appropriate counterbalancing strategies for each independent variable, we now need to delve into the more detailed arrangement of experiment trials and blocks (see Fig ure 4.2 ).
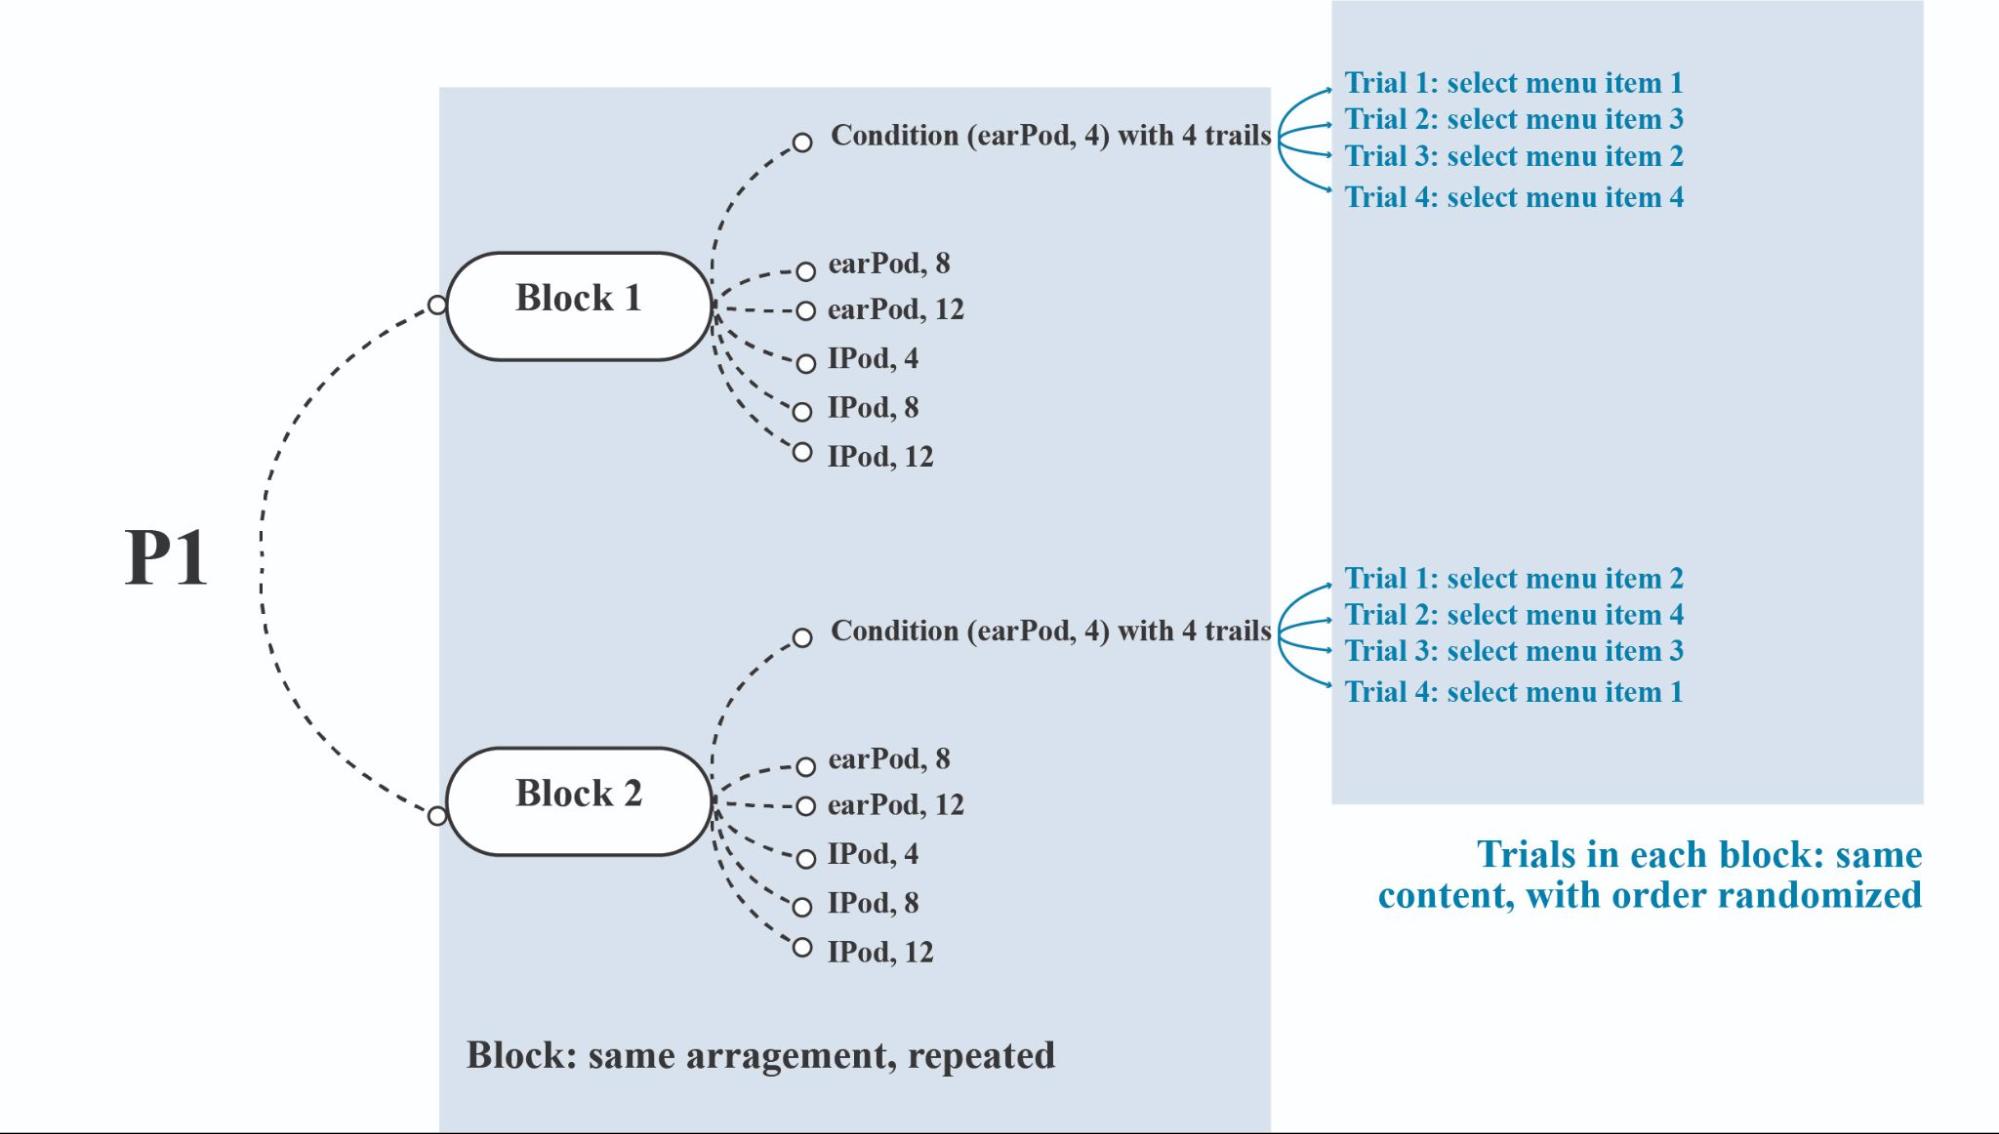
Figure 4.2 Example arrangement of blocks and trials for a single participant (P1).
A trial is a single repetition of a condition or cell, and several trials are used to increase reliability. On the other hand, a block is an entire section of the experiment that is repeated to analyze learning. The trials in each block have the same content, but their order is randomized to reduce order effects.
To determine the number of blocks and repetitions, the researcher must consider several factors. These include the reasonable experiment duration, time constraints, fatigue, and the need for enough data points to detect significant effects.
For example, the experiment should be designed to fit within a reasonable time frame, typically within one hour. However, this may be shorter if pre- and post-experiment interviews are included, leaving only 45 minutes for the actual experiment. In some cases, the experiment may take up to 2 hours.
Additionally, the number of blocks and repetitions should be sufficient to generate enough data points to detect significant effects. The exact number will depend on the specific experiment and its goals, as well as the number of independent variables, levels, and participants involved.
Overall, determining Blocks and Trials involves 4 steps:
- Step 4.1: estimate the time for each trial (typically at least 3 trials per condition)
- Step 4.2: estimate the time for each block
- Step 4.3: balance the trials and blocks so that the main part of the experiment is within 45 minutes
- Step 4.4: combine with the condition arrangement
Exercise 4.4: Blocks and Trials Design Consider you are designing an experiment to evaluate three different text input methods (voice, keyboard, and gesture) on a smartwatch. You want to test these methods under two different contexts (sitting and walking).
Let's solve this step by step:
Step 4.1: Estimate time for each trial
- Each trial is estimated to take 30 seconds
- Need at least 3 trials per condition as specified
Step 4.2: Estimate time for each block
- Total conditions = 3 input methods × 2 contexts = 6 conditions
- Trials per block = 6 conditions × 3 repetitions = 18 trials
- Time per block = 18 trials × 30 seconds = 9 minutes
Step 4.3: Balance trials and blocks Total experiment time:
- 4 blocks × 9 minutes = 36 minutes for trials
- 3 breaks × 3 minutes = 9 minutes
- Total duration = 45 minutes (meeting the 45-minute guideline)
Step 4.4: Condition arrangement To minimize order effects:
- Use Latin Square design for input methods
- Counterbalance contexts within each input method
- Randomize phrase presentation within each condition
Answers to questions:
- 6 conditions total (3 input methods × 2 contexts)
- 18 trials per block (6 conditions × 3 repetitions)
- 45 minutes total (36 minutes for trials + 9 minutes for breaks)
- Recommended arrangement:
- Latin Square for input methods across 4 blocks
- Within each block, alternate sitting/walking contexts
- Each block contains all conditions (3 methods × 2 contexts)
- Randomize text phrases within each condition
- Include 3-minute breaks between blocks
4.6 Step 5: Set Instructions and Trials
After determining blocks and trials, the next crucial step is establishing clear instructions and procedures for conducting the experiment. This step is essential as it directly impacts how experiments are carried out and ensures respect for participants.
The process can be broken down into 7 chronological substeps:
Before Experiment:
- Step 5.1: Recruiting Participants
- Step 5.2: Consent Form & Pre-experiment Questionnaire
- Step 5.3: Instructions
- Step 5.4: Practice Trials
During Experiment:
- Step 5.5: Main Experiment with Breaks
After Experiment:
- Step 5.6: Post-experiment Questionnaire & Interview
- Step 5.7: Debriefing
Step 5.1 Recruiting Participants
Two key considerations:
- Determining target users - Specify qualified participant groups based on research needs
- Randomizing user characteristics - Balance participant demographics while staying within target groups
Step 5.2 Consent Form & Pre-experiment Questionnaire
The consent form protects participants' legal rights and should include:
- Researcher/institution information
- Study procedures and data collection details
- Participant rights and compensation
- Explicit consent confirmation
Pre-experiment questionnaires gather participant background information.
Step 5.3-5.4 Instructions & Practice Trials
- Clear directions for completing tasks
- Practice trials allow participants to:
- Familiarize with procedures
- Reduce learning effects during main trials
- Test experimental process feasibility
Step 5.5 Main Experiment with Breaks
Key points:
- Maintain researcher objectivity and neutrality
- Include regular breaks to prevent fatigue
- Document observations
Step 5.6-5.7 Post-experiment Steps
- Gather participant feedback via questionnaires/interviews
- Debrief participants on study objectives
- Address questions and concerns
- Document insights for analysis
Conclusion
This chapter has outlined a systematic 5-step approach to designing and conducting HCI experiments, providing a structured framework for researchers to follow. While this methodology helps streamline the process and makes experiment design more approachable for novice researchers, it's important to note that designing rigorous experiments remains a complex undertaking.
The approach guides researchers through establishing clear research questions and hypotheses, determining appropriate variables and measures, planning experimental design and controls, calculating sample size and blocks, and developing detailed procedures. Each step builds upon the previous ones to create a comprehensive experimental protocol.
While this framework provides a solid foundation, researchers are strongly encouraged to consult with experienced colleagues and methodological experts when designing studies. Their expertise can help refine designs, identify potential pitfalls, and ensure scientific rigor.
The goal of this systematic approach is not to oversimplify experimental design, but rather to make it less intimidating and provide clear starting points for researchers new to HCI experimentation. With these guidelines as a foundation, and appropriate expert consultation, researchers can develop high-quality studies that advance our understanding of human-computer interaction while maintaining scientific integrity and participant protections.
Also, this chapter also concludes the discussion on the introduction to empirical research in HCI. However, the field of empirical research is vast, and true mastery requires ongoing learning and experience.
For those wishing to deepen their knowledge, we highly recommend several key resources. I. Scott MacKenzie's Human-Computer Interaction: An Empirical Research Perspective offers a comprehensive guide to empirical methods specifically within HCI. For an accessible yet thorough understanding of statistical analysis, which is fundamental to interpreting experimental results, Andy Field's Discovering Statistics Using... series (e.g., for IBM SPSS Statistics or R) is an excellent choice. Furthermore, to explore the broader landscape of research methodologies beyond controlled experiments, a comprehensive text like Research Methods in Human-Computer Interaction (e.g., by Lazar, Feng, and Hochheiser) can provide invaluable insights into various qualitative and quantitative approaches.
Empirical research forms a critical pillar of HCI, enabling us to understand user behavior, evaluate system effectiveness, and build a solid evidence base for design decisions. In the next chapter, we will transition to explore constructive research, an approach often considered distinctive to HCI, where the creation of novel artifacts and systems itself serves as a primary mode of inquiry and knowledge generation.
References
Gladwell, M. (2007). Blink: The power of thinking without thinking. Back bay books.
Plassmann, H., O'doherty, J., Shiv, B., & Rangel, A. (2008). Marketing actions can modulate neural representations of experienced pleasantness. Proceedings of the national academy of sciences, 105(3), 1050-1054.
MacKenzie, I. S. (2013). Human-computer interaction: An empirical research perspective.Morgan Kaufmann.
Zhao, S., Dragicevic, P., Chignell, M., Balakrishnan, R., & Baudisch, P. (2007, April). Earpod: eyes-free menu selection using touch input and reactive audio feedback. In Proceedings of the SIGCHI conference on Human factors in computing systems (pp. 1395-1404).
Card, S. K., Moran, T. P., & Newell, A. (1983). The psychology of human-computer interaction. Hillsdale, NJ: L. Erlbaum Associates.
Nielsen, J., & Phillips, V. L. (1993, May). Estimating the relative usability of two interfaces: Heuristic, formal, and empirical methods compared. In Proceedings of the INTERACT'93 and CHI'93 conference on Human factors in computing systems (pp. 214-221).
Soukoreff, R. W., & MacKenzie, I. S. (2003, April). Metrics for text entry research: An evaluation of MSD and KSPC, and a new unified error metric. In Proceedings of the SIGCHI conference on Human factors in computing systems (pp. 113-120).
Grossman, T., Fitzmaurice, G., & Attar, R. (2009, April). A survey of software learnability: metrics, methodologies and guidelines. In Proceedings of the sigchi conference on human factors in computing systems (pp. 649-658).
Brooke, J. (1996). SUS-A quick and dirty usability scale. Usability evaluation in industry, 189(194), 4-7.
Hart, S. G., & Staveland, L. E. (1988). Development of NASA-TLX (Task Load Index): Results of empirical and theoretical research. In Advances in psychology (Vol. 52, pp. 139-183). North-Holland.
Zheng, Q., Chen, M., Sharma, P., Tang, Y., Oswal, M., Liu, Y., & Huang, Y. (2025, April). EvAlignUX: Advancing UX Evaluation through LLM-Supported Metrics Exploration. In Proceedings of the 2025 CHI Conference on Human Factors in Computing Systems (pp. 1-25).