Chapter 9: Writing your HCI research paper
In Chapter 9 , we will delve into the process of writing your paper, providing valuable tips and guidelines to enhance your writing skills. We will explore the step-by-step approach followed by our lab, covering various sections of a research paper, from the abstract to the conclusion.
9.1 The order of writing:
Writing can be a long and painful process. If not well managed, it can cause a lot of additional frustration. We suggest the following order of writing the different components to help to achieve maximum gain, minimum efforts during the writing process. While this process can help to reduce the amount of effort, writing is still a difficult task that will take a considerable amount of time, so start early and get frequent feedback so that it can achieve the necessary quality for submission on time.
Step 1: Abstract
Abstract helps you to define the main research contribution and set the focus of the paper. It's also easy to write, so do that first (typically right after you have an idea that you want to perform pilot study with).
Step 2: Outline
Outline serves as a research agenda for a potential project. It's typically written down after your pilot study has shown some promising results. It helps to organize your thoughts before planning for the entire project.
Step 3: Design Space Exploration (Optional)
If this paper involves a design space exploration, it is typically done before the first major experiment, so it's good to write it down before writing the first study or sometimes, after the first study. It depends on the nature of the first study. Sometimes, the first study is to establish the feasibility of something — for example, using an image/icon is better than using text in notifications, so the first study is just to establish that this concept is viable, and the authors plan to establish the best icon design in the second study. If that's the case, it makes more logical sense to perform the design space analysis after the first study. Otherwise, the design space analysis will be performed before the first study, but will be written together.
Step 4: Research Questions & Experimental Method
Write research questions & experimental method for your first major study: The first major study is typically the core component of your paper. It is often the study that establishes the new technique you are proposing or the study that answers the main research question of the paper. For example, in the LSVP paper ( Ram & Zhao, 2021 ), it is the study that defines the LSVP technique by comparing the three different types of presentation techniques. The result of the study defines the concept of LSVP, and it needs to be done first. Note that the first study you work on is not necessarily the first study you report in the paper. In Ashwin's LSVP case, the first study reported in the paper is an interview + survey study to establish the motivation of Heads-Up video learning. This needs to be done after the pilot study, before conducting the full experiment. Through writing, we will know if the experimental method looks reasonable/robust or not before we conduct the full experiment. The cost to fix is much higher if we conduct the experiment first then go back to write the experiment design section. If any flaws are detected at that stage, you may need to re-conduct your experiment, which can be extremely frustrating.
Step 5: Results and Discussion of Study 1
Write the result and discussion of study 1: Before you move on to your second study. It's important to write down the result and discussion section of your first study. This serves two purposes: 1) it helps you to get a basic understanding of whether or not you have a good case for a paper. If it reads well, congratulations, you have developed a solid case for your paper. 2) it helps you to better plan your second study. What questions you didn't answer in your first study but will very likely be questioned by reviewers? If there are any such questions, make sure they are answered in the second study. Those questions sometimes are not obvious until you have finished writing the result/discussion section of the first study.
Step 6: Additional Studies
Repeat steps 4-5 for your second, and possibly the third studies. Typically, a paper will minimally have 2 studies and maximally contain 3 studies, so you should stop after study 3. Note there are exceptions to this: I can imagine a very solid study that can be a paper by itself, or in some cases, 4 studies to be packed into 1 paper, but they are exceptions, not the norm.
Step 7: Implementation Section
Write the implementation section: It might be a good idea to write the implementation after the experiments are settled. This is because the result of experiments could affect the implementation again. It's a good idea to write implementations after we know it won't change anymore.
Step 8: Literature Review and Introduction
You might wonder why we write the literature review and introduction last, when they appear first in the paper. While it may seem counterintuitive, there are several important reasons for this approach:
- Your Story Emerges from Results : The results of your studies ultimately determine your paper's main narrative and emphasis. Different outcomes can lead to different focal points, which in turn affect how you frame the introduction and contextualize prior work.
- Targeted Literature Review : Once you know your key findings and contributions, you can more effectively highlight the most relevant prior work that sets up your research questions and demonstrates the novelty of your approach. This prevents wasting time discussing tangential work that ends up being less relevant to your final narrative.
- Clear Research Gap : With your results in hand, you can more precisely articulate the gap in existing literature that your work addresses. This makes for a stronger motivation section that naturally leads to your contributions.
- Cohesive Narrative : Writing the introduction last allows you to craft a compelling story that seamlessly connects to your methodology and findings, rather than trying to retrofit your results into a pre-written introduction.
Note that this doesn't mean you should delay reading related work - literature review as an activity should happen throughout your research process, particularly:
- Before starting the project to identify research opportunities
- After pilot studies to ensure novelty
- During study design to inform methodology
- When interpreting results to contextualize findings
The key distinction is between when you conduct the literature review versus when you write it up formally in the paper. By writing these sections last, you can present the most relevant prior work in a way that best supports your paper's ultimate contributions.
Step 9: Final Refinements
Refine title, money shot, abstract, and keywords before submission: To help a paper to be remembered, we need a good title, a clear and memorable money shot, well-written abstract, and easy to search keywords. Determine them after the entire paper is in good shape. Do them at last.
Now that we have outlined the overall order of writing your HCI research paper, let's delve into how to write each of these sections effectively. We'll start with the abstract and work our way through each component, providing detailed guidance and examples to help you craft a compelling research narrative.
9.1.1 Abstract
The abstract is arguably the most crucial part of your paper because it may determine whether the audience decides to read on. It is a distilled version of your entire research, highlighting the main contribution and setting the paper's focus. You should write the abstract early, typically after a pilot study confirms the viability of your research concept. It may follow this structure:
-
Opening Statement
: Begin by setting the context for the users and their task. Identify the current best-known solution and its limitations.
Example Guideline : "<Users> trying to perform <task> struggle due to <limitation>." -
Introduce the Contribution
: Clearly state your proposed solution and its primary advantage over the existing solutions.
Example Guideline : "In this paper, we present <proposedSolution>, which addresses <limitation>." -
Describe the Approach
: Briefly describe how your solution overcomes the limitation. This is often the novel aspect of your research.
Example Guideline : "Our approach, <newFeatureOrApproach>, enables <proposedSolution> to overcome <limitation>." - Results (Speculative if Necessary) : While abstracts can be written at different stages of research, we recommend writing an initial version at the very beginning of your project, before conducting formal studies. At this early stage, you'll need to speculate about potential results based on your initial insights, as this abstract serves as a thought experiment to validate your research direction. Later versions of the abstract will incorporate actual findings as they become available. Example Guideline : "We hypothesize that <proposedSolution> will result in <expectedOutcome>."
- Advantages and Impact : In this early abstract, outline the anticipated advantages and potential impact of your solution, even without formal results. This helps establish whether the research direction is promising enough to warrant building your first prototype and conducting pilot studies. If you've done any preliminary explorations, you can incorporate those initial insights. Example Guideline : "[In a user study, we anticipate that] participants will complete <task> [faster/more accurately] when using <proposedSolution> compared to <bestKnownSolution>."
While the initial abstract helps validate your research direction early on, you'll need to revise it substantially once your research is complete. At this final stage, the abstract shifts from speculative to definitive, presenting concrete findings rather than anticipated results. The structure remains similar, but the language and content change to reflect your actual contributions and empirical evidence.
When revising your abstract for the final paper, transform speculative language into concrete findings:
- Use Definitive Statements : Replace hypothetical phrases with actual results. Example : "Users performed 30% faster" instead of "We anticipate users will perform better."
- Include Specific Data : Present concrete statistics from your studies. Example: "In our user study (n=24), participants completed tasks 40% faster with our system."
- Highlight Validated Results : Focus on demonstrated outcomes. Example: "Our results show that gesture-based input significantly improves task completion time while reducing fatigue."
Write concisely but completely — every word should serve a purpose, delivering a precise preview of your validated contributions. The abstract guides readers through your narrative with clear, evidence-based statements rather than promises or speculation.
9.1.2 Outline
An outline is akin to the skeleton or sketch of your paper. It allows you to visualize the potential shape of your paper, helping you determine if it has enough contributions and how the narrative should unfold. An outline also serves as your research agenda, assisting you in planning your time and resources effectively.
When to Write an Outline An outline typically should be one of the first things you write when starting a research project. Or sometimes if you are exploring a new topic, you may not have enough knowledge to write an outline yet, in this case, you can spend some time familiarizing yourself with the topic, then write an outline when you become more knowledgeable. But don't wait too long, as soon as you have gained some knowledge, you can get started with an outline. It may look sloppy in the first few iterations, but it's important to iterate on it early as it serves as a research agenda. Over time , it evolves and enriches itself. With a well-structured outline, you'll have a clear understanding of what to do next and how much effort you should put into each task.
What Should an Outline Include? Contrary to what many new students believe, an outline is not just an introduction that motivates the paper. The introduction answers a crucial question: Is there a valid reason to pursue this research? This question should be settled before any research projects begin. Therefore, when writing an outline, you should concentrate on outlining the potential research contributions of your paper.
Possible Research Contributions Different types of papers offer different avenues for contribution. For an empirical paper, a study that answers a research question can be a significant contribution. For an artifact paper, a design space exploration or a study that compares the proposed solution with baselines and state-of-the-art solutions can serve as valuable contributions. Depending on the type of your research, you need to sketch out "enough" concrete contributions in your outline to form a paper. For a top-tier empirical research paper, there should probably be at least 3 studies that answer 3 key research questions related to your research topic. For an artifact paper, the main contribution comes from a novel technique/system that demonstrates significant advantages either by demonstration (be the first), or by comparing with the state-of-the-art solution (be the best), design spaces that summarize the design possibilities, or empirical studies to justify particular design decisions, etc. In your outline, you need to concretely describe what these contributions are, and how they are connected together to form a paper.
Remember, it is very important to be able to sketch out an outline that contains "enough" contributions for a paper as soon as possible. Sometimes, you might have some interesting findings, but they may not be enough for a full paper. In such cases, your priority should be to find additional research questions or innovative designs to ensure enough research contributions before moving forward.
Level of Detail in the Outline When writing an outline, avoid lengthy paragraphs. Instead, use concise sentences and bullet points to clearly demonstrate the potential contributions. Remember, an outline evolves frequently depending on the study's results or the design of the solution, so avoid spending time polishing content that might change. On the other hand, there should be enough details to clearly demonstrate your potential contribution (which research question does it attempt to answer, what are the interesting/surprising findings, what is the content of the design space, what is the design justifications, etc.). You may not have the results yet, but you can imagine the results/insights/advantages, etc. to show the potential contributions.
Time Allocation for Writing an Outline For each outline, dedicate a few hours to half a day — no more. Once you've developed an outline, share it with your collaborators and get feedback. A common mistake is spending days working on an outline without seeking feedback, resulting in wasted time.
Empirical Research Study
An outline for empirical research provides a skeleton of a study that helps answer a research question. It includes key elements such as the research questions, study design, tasks, independent and dependent variables, possible outcomes, and stopping conditions. The following example is provided by Nuwan Janaka. Note that the following is only the outline of one study, which is not enough for a paper. For your outline, you probably need to provide enough contributions (probably adding 2 more studies) to make it a complete outline.
Assumption/vision
- Optical head-mounted displays (OHMDs) will be the everyday mobile companion (and will complement/replace mobile phones) that users wear in everyday settings
- In such cases, notifications that appear on OHMDs can interrupt people's daily activities
- We are interested in figuring out design features of OHMD notifications that can mitigate interruption to users' primary tasks
- One design feature we are interested in is the animation and timing of notifications
- According to attention and interruption research, users can better manage task switching when the secondary notification appears in a gradual fashion instead of instantaneously
- The previous results were carried out on desktop computers in stationary settings. Do the same results apply to OHMD in mobile settings?
Background
OHMDs can be used in 2 scenarios:
- Stationary setting
- Mobile settings
Study 1: Compare OHMD notifications while engaging in a primary task on stationary setting vs mobile settings
To reduce the interruption of the sudden appearance of OHMD notifications, we focused on fading animation, which has been shown to be effective for desktop notifications.
Independent variables (IVs)
- Primary Task Device (primary task = proofreading)
- OHMD (sitting)
- Black/blank computer screen around 1 m in front
- OHMD (walking)
- Black/blank computer screen around 1 m in front
- Animation type
- Fast-Fading (G = 2): notification comes to full brightness after 2 seconds
- Slow-Fading 4 (G = 4): notification comes to full brightness after 4 seconds
- Instant (G = 0): notifications immediately appear
- Swipe down with instant (T = 0): notification swipes down from top within 330 ms (current way of presentation)
Research Questions
RQ1: How does the fading animation compare to the blast and scrolling animations in terms of task performance and perceived distraction during multitasking? Is there an optimal fading duration?
- H1: Fading animation reduces the interference to primary tasks compared to instant and scrolling animation
- H2: Fading animation is less distracting and cognitively less demanding than instant and scrolling animation
- H3: There is an optimal range for fading duration
RQ2: Does the effect of fading depend on the primary task context?
- H4: Interruption of OHMD notifications in mobile walking condition will be lower for the primary task on OHMD than the primary task on stationary condition
- H5: Optimal fading duration depends on the primary task context
Dependent variables (within-subject)
- Primary task:
- Reading time
- Reading accuracy
- Adjusted reading accuracy = reading accuracy/reading time (consider the effect of slowing reading to increase accuracy) ( Rayner, 1998 )
- Secondary task:
- Notification recognition accuracy
- Noticeability of notifications
- Understandability of notifications
- Perceived effects of interruption
- Perceived interruption
- Perceived task load (NASA-TLX)
Possible outcomes and potential implications
There many possible outcomes:
- Gradual notification produces less interruptions as compared with existing notification display styles in mobile walking conditions (users are able to read text better and resume reading faster), but is similar to the existing design in stationary settings because XXX
- Implications: notification needs to be designed differently for OHMD in mobile conditions, which can significantly reduce interruption to users' primary task. Given the importance of notification in everyday usage, this can be an impactful result
- Gradual notification is no better than existing design in all conditions
- The result has no practical implications as there is no change needed for existing design, however, this result is different from the literature. If we can find out why it is so and provide an insightful analysis, this can still be a paper that offers new knowledge to the community
Artifact Outline
ParaGlassMenu
Note: this is a paper about a be-the-best novel menu technique for subtle interactions during face to face conversion settings
Introduction
- Interacting with digital information has become a ubiquitous task, even in conversation
- Interaction Type [mentioned in Related Work]
- Related to the conversation topic or involved parties
- Handling personal issues or conversation-irrelevant tasks
- It brings convenience and positive effects
- It also brings negative effects, e.g.:
- Going against the established social norms
- Reducing the perceived communication quality
- Degrading social relationships
- Creating misperceptions
- Add: distractions (to both users and conversation partners)
- To balance the utility and disruption of digital interaction in social settings, subtle interaction could be the solution
- Reason (involves 2 definitions of subtle interaction)
- Non-intrusive to users' attention -> better focus on conversation (distraction to users)
- Hiding the activities -> avoid interruption (distraction to others)
- Current Approach
- Attention-maintaining interface
- Enable non-intrusive notification
- Not support subtle input while bi-directional interaction is common in daily life
- We proposed ParaGlassMenu
- Support non-intrusive menu and subtle thumb-index interaction (ring mouse input)
- Justification in [Related Work]
- Why non-intrusive menu
- Help maintain attention
- Why ring mouse
- Other inputs either have low accuracy, e.g. foot interaction
- Or hard to maintain eye contact with others, e.g. gaze interaction
- Thumb-index interactions do not influence eye contact and enable high accuracy
- Ring mouse is better than other hand-held devices due to easiness of carrying and hiding
- Develop IoT applications to evaluate its usage and solve realistic issues users faced in daily life (Provide example)
- Users in a meeting may want to lower the Air Con speed when feeling cold. With ParaGlassMenu, they can manipulate it secretly to avoid interruption while maintaining attention when others are speaking
- Host in conversation wants to check the rice cook's remaining time before dinner, but it is not necessary to tell the guest. With our tool, the host can do it subtly while maintaining attention on the guest
Propose the ParaClassMenu Technique and describe its details
...
Evaluations
Study 1: In the lab evaluation
- Comparative study in lab-controlled settings [N=20]
- Comparative interfaces: Phone, Voice, and Linear Menu
- Justification [in Related Work]
- Phone & Voice
- Current IoT manipulation methods are either hard to support eye contact or hard to hide activities that enable opaque manipulation. Thus we need to select representative baselines which cover these two limitations
- Previous studies compare subtle interaction with traditional commercial interfaces
- Linear Menu
- Find the most suitable layout <so there are two RQs?>
- Task:
- Check info
- Control
- Discrete manipulation
- Continuous manipulation
- Select from list
- Justification
- Two types of IoT tasks are defined by previous studies: check info and control
- In the control task, we have three subtasks based on the analysis of google home traits
- Measure
- Quality of conversation
- [O] Face focus
- [S] Politeness, Naturalness, perceived workload
- Quality of IoT manipulation
- [O] Duration, Accuracy
- [S] Relaxation, SUS
- Results:
- ParaGlassMenu helped users maintain attention on their conversation partner and allowed them to control IoT devices with the highest usability in a socially acceptable manner
- Most preferred interfaces
Study 2: Verify the external validity of ParaGlassMenu (study 1 results) in modeled realistic setting [N=12 pairs]
- IV: With / Without IoT manipulation
- No_IoT condition (baseline): measured the conversation's quality without the usage of ParaGlassMenu and confounding factors due to current limitations with OHMDs, such as weight and appearance
- Task:
- No_IoT condition: Friends Talk, no IoT manipulation (but can adjust the environment before the study)
- IoT condition: Friends Talk, IoT manipulation
- Measure
- Quality of conversation
- [S] Attention & concentration, Eye contact, Naturalness, Perceived impact of OHMD
- Quality of IoT manipulation
- [O] Duration, usage
- [S] Relaxation, SUS, Interruption, Politeness, Hospitality
- Results
- Hosts could manipulate IoT devices in a relaxed and polite manner using the ParaGlassMenu Interface to cater to both the hosts' and guests' needs with low interference to conversations
Discussion
- The majority of users didn't deactivate the menu
- Keep it is non-intrusive
- Keep it after starting the "pending" task
- It suggests auto-deactivation based on the type of task
- Two visibility of manipulation were found <this is expected, right?>
- Depends on awareness management
- To ease the burden of multitasking
- Limitations
- Ring mouse sensitivity & click sound
- OHMD limitations
- Should support guidance for new users
Overall discussion
- Recap RQ1 & RQ2 based on study results
- TODO: How to generalize the visibility of IoT manipulation to general digital interaction
- What tasks can be done visibly & what tasks users tend to hide (e.g., checking info could be done subtly, controlling could be done visibly)
- Depends on social
- Multi-tasking ability
- <provide improvement/options>
- Cake surprise example
- Enhance the ParaGlassMenu
- Enhance thumb-index interaction
- Support two visibility of manipulation
- Especially for the transparent task since our current work mainly design for the hiding manipulation
- Optimize the breadth & width of the menu
- Extend the ParaGlassMenu to other scenarios where users need to maintain attention on the center target while engaged with digital interactions
- Potential conflict with social norms
- Whether users will be easily distracted from the conversation if more subtle conversation-irrelevant apps are provided in the future
- Whether it would be misperceived: misperceived manipulation even though the users didn't manipulate the device
Knowing what to focus on Once you've written an outline, you need to use it to determine what to focus on for your next steps. Here is a guiding principle. Focus on finding a "believable" but "rough" answer for the biggest unknown of your main contribution first. For instance, if your paper aims to present a superior solution, your biggest contribution is that your solution outperforms the state-of-the-art. Thus, your priority should be confirming this. Conversely, if your paper is about empirical findings, your priority is to discover new and surprising findings through pilot studies. Note that we emphasize the words "believable" and "rough". This means you just need to collect enough evidence to convince yourself and your collaborators that the findings/advantages are true, but don't need to get statistical significance or formal confirmations at this stage. The first priority is always to gain a big picture of the paper first, before diving into the details of every step. Don't focus on detailed work until you already gain a big picture of what the paper is about and its main contributions are.
Knowing When to Change Direction One crucial point in any project is knowing when to cut losses. If the results aren't promising, consider changing direction or trying a different idea. Consult with your supervisor or seniors if you're unsure—it's wiser to switch to a more promising problem than persist with an unpromising one.
9.1.3 Design Space Exploration (Optional)
In cases where your paper involves exploring a design space, this step can be crucial. The timing of writing about the design space exploration will depend on how it fits logically with the studies you are conducting. Below we introduce an example of how to write this section.
1. Introduce the Problem and Your Conceptual Solution
Begin by clearly stating the problem your research is addressing. Then, introduce your conceptual solution as a response to this problem, providing the justification for why this solution is worth exploring.
Example Guide
- “Start with a statement like: 'Current touch interfaces lead to occlusion and user fatigue. We propose a full mouse emulation technique, leveraging multi-touch capabilities without the need for direct screen contact.'”
2. Outline Desirable Properties
Describe the ideal characteristics of your solution. Be clear about the functionality you aim to support and the design properties you wish to achieve. These should be derived from user needs, theoretical considerations, or a review of existing solutions.
Example Guide
- “List the design goals and properties, such as 'minimal fatigue,' 'high precision,' and 'intuitive mapping,' then discuss how each property contributes to the overall usability and effectiveness of the solution.”
3. Detail the Design Space Exploration
Write about how you explored the design space. Include the methodologies you used to arrive at various design factors, such as literature reviews, taxonomy development, or affinity diagrams.
Example Guide
- “Explain how you generated the design space, possibly saying, 'We derived a set of potential design factors through a comprehensive literature review, followed by a series of affinity diagramming sessions to cluster related concepts.'”
4. Discuss Methodology and Criteria
Clarify how you determined which factors to include or exclude. Discuss the rationale behind these decisions and the methodologies for establishing these criteria.
Example Guide
- “Describe the systematic process for inclusion and exclusion, stating, 'Factors were evaluated based on their relevance to the core user tasks identified in preliminary studies. Those that did not directly contribute to task efficiency or user comfort were excluded.'”
5. Filter Through Pilot Studies
Detail how you used pilot studies and other methods like constraint analysis to filter down to a testable set of factors. This should be a narrative of narrowing down the possibilities to a manageable and focused set for further testing.
Example Guide
- “Narrate the process of elimination and selection, for instance: 'Pilot studies helped us identify which multi-touch gestures were most natural for users, allowing us to refine the design space to those that also met our ergonomic criteria.'”
6. Present the Final Selection for Evaluation
After filtering, present the subset of design factors that you have chosen for detailed evaluation. Explain why these particular factors were chosen and how they will be tested.
Example Guide
- “Conclude with a statement like: 'The final design factors chosen for evaluation reflect a balance between user performance and ergonomic design, as indicated by our pilot studies.'”
7. Discuss the Usage Context and HCI Community Impact
Explain why your exploration is significant within the scope of HCI and how it contributes to the field. This helps in establishing the relevance and potential impact of your research.
Example Guide
- “Emphasize the importance of the design exploration by saying, 'Our focused approach to mode-switching gestures has implications for the broader field of touch interface design, addressing a key usability challenge identified in the HCI community.'”
8. Summarize with a Q&A Section
Address potential questions about this process. This section can clarify common queries and elaborate on the methodological choices you made.
Example Guide
- “Include a Q&A section that might start with a question like, 'How were the inclusion and exclusion criteria determined for the design factors?' followed by a succinct answer that references your methodological approach.”
By following these steps, you ensure that the Design Space Exploration section of your paper is methodical, clear, and contributes a structured narrative to the field of HCI research. Remember to support your writing with appropriate citations, tables, and figures where necessary to illustrate your process and findings.
9.1.4 Writing Research Questions & Experimental Method
The core study or studies in your paper should be thoroughly planned out before you conduct them. This involves writing detailed research questions and a robust experimental method.
1. Articulate Research Objectives
Begin with a precise statement of your research objectives, which encapsulate the goals and scope of your study. These objectives should stem from identified gaps in the existing literature or practical challenges in HCI.
Example Guide :
- “The primary objective of this study is to assess the effectiveness of gesture-based navigation in reducing physical strain during extended virtual reality sessions.”
2. Formulate Research Questions
Crafting research questions involves delving into the specifics of what you aim to uncover or understand through your research. Qualitative questions should open up exploration into your subject matter, while quantitative questions should aim to measure and test specific variables.
Example Guide :
- For qualitative questions, start with broad, open-ended inquiries like, “What are the user experience challenges when interacting with gesture-based controls in virtual reality?”
- For quantitative questions, focus on precise, measurable inquiries such as, “Does the use of gesture-based controls decrease the time taken to complete a navigation task in a virtual environment?”
3. Develop Research Hypotheses
Hypotheses are conjectural statements predicting the outcomes of your study. They should be clear and testable, stating the expected relationship between variables.
Example Guide :
- A null hypothesis might be, “There is no significant difference in task completion time between gesture-based and traditional controller-based navigation in virtual reality.”
- An alternative hypothesis could be, “Users will complete navigation tasks more quickly using gesture-based controls compared to traditional controllers in virtual reality.”
4. Outline the Experimental Method
Your experimental method is the blueprint of your study. It should detail the design, materials, participants, procedure, and the method of analysis. Each experiment must align with your research questions and hypotheses.
Example Guide :
- Discuss the setup of your virtual environment, the tasks participants will perform, and the metrics for measuring task completion time.
- Detail how you will record the data, the type of statistical analysis you will use, and how this will test your hypotheses.
5. State Your Research Objectives
Your paper should start with a clear statement of research objectives, which guide the subsequent experiments and questions. This sets the stage for your research narrative.
Example Guide :
- “Our research aims to determine the most efficient and user-friendly input method for virtual reality navigation, seeking to contribute to ergonomic design principles in immersive environments.”
6. Link Research Questions to Hypotheses
Each research question should be directly followed by one or more hypotheses that predict the outcome of investigating that question.
Example Guide :
- “Research Question 1: How does gesture-based control affect user performance in virtual reality navigation? Hypothesis 1.1: Users will navigate more efficiently using gesture-based controls. Hypothesis 1.2: Gesture-based controls will reduce the physical strain as measured by reported user fatigue.”
7. Detail Experiment Designs
Provide a comprehensive description of each experiment, including design, procedure, and expected outcomes. Make it clear how each experiment relates to your hypotheses.
Example Guide :
- “Experiment 1 will involve a controlled lab study where participants navigate a virtual environment using both gesture-based controls and traditional controllers. We will measure the time to completion and self-reported fatigue levels.”
8. Discuss Results and Contributions
Each experiment should conclude with its own set of results and a discussion on how these contribute to answering the research question. The paper should culminate in an overarching discussion that ties the individual experiments back to the research objectives.
Example Guide
:
-
“The results from Experiment 1 suggest that gesture-based controls can reduce task completion time. This supports Hypothesis 1.1 and indicates that our objective to improve efficiency in virtual reality navigation is attainable.”
By adhering to this structure, you ensure that your research questions, hypotheses, and experiments are coherently presented, making your paper logical, comprehensive, and contributory to the HCI community.
9.1.5 Experiment Design for Study 1
Writing the experiment design section typically follows a standard template, which involves the following two parts:
• Experiment setup and procedure • Overview • Research questions • Participants • Apparatus/setup • Task and stimuli • Design and procedure • Dependent measures Results
Let's examine each of these components in detail to understand how to effectively write an experiment design section:
Overview It's important to clearly state the goal(s) of the experiment, as they directly guide and justify your experimental design choices. Without clearly stated goals, readers cannot evaluate whether your methodology is appropriate or properly interpret your results. The experimental goals serve as the foundation that connects your research questions to your methodological decisions and findings.
The overview's complexity should match the experiment's scope. For straightforward comparisons or validations, a single sentence may suffice: "The goal is to empirically compare mode-switching performance of the X number of techniques listed above".
For more complex studies investigating multiple aspects or novel techniques, a structured set of research questions is more appropriate. For example: "To validate our analysis that using simple marks could be a promising technique, we conducted an experiment that compares the simple and compound mark techniques, with particular emphasis on the following questions:
Q1: How do simple marks compare to compound marks in terms of speed and accuracy? Previous research has conclusively shown that compound mark hierarchical marking menus are an effective technique, and significantly outperform regular radial and linear menus. Since simple marks can eliminate some limitations of compound marks, they do not necessarily need to outperform compound marks to be useful, but should be at least equivalent in speed and accuracy. The physical motions required are quite different - simple marks need multiple pen up/down actions but no inflections, while compound marks need only one pen up/down but several inflections. This tradeoff between mark complexity and number of actions makes the performance comparison unclear.
Q2: Do simple marks permit deeper hierarchies? Our theoretical analysis suggests simple marks should allow selection from arbitrarily deep menu hierarchies with only a linear additive cost per level, assuming constant menu breadth. Of particular interest is whether we can exceed the compound mark limitation of two levels with eight items each (64 total items). If simple marks enable three levels of eight items (512 total items), that would be a significant advantage. However, practical limitations may prevent achieving the theoretical benefits.
Q3: How does user fatigue differ between simple and compound marks over extended use? Since simple marks allow overlapping gestures that can be made with just finger movements while resting the wrist, they may enable better performance and reduced fatigue compared to compound marks that require larger wrist/arm movements. Understanding these ergonomic differences is important for predicting long-term usability and user acceptance.
...
Research questions become interesting and worth investigating when they have certain key characteristics:
- The answer is not immediately obvious from theory or prior work alone
- The question has meaningful practical implications if answered
- The findings would advance our theoretical understanding
- The results could challenge or validate existing assumptions
Looking at the three research questions above, each elaboration helps to demonstrate why the question is interesting and worth investigating by embodying these principles:
For Q1, the elaboration highlights the non-obvious nature by explaining the tradeoff between mark complexity and number of actions. By pointing out that simple marks require multiple pen up/down actions but no inflections, while compound marks need only one pen up/down but several inflections, it creates uncertainty about which approach would perform better. This makes the performance comparison genuinely interesting since the outcome isn't immediately apparent from theory alone.
For Q2, the elaboration establishes practical significance by discussing how simple marks could potentially overcome a major limitation of compound marks (the two-level, 64-item limit). The possibility of enabling three levels with 512 total items would represent a significant practical advancement. However, the elaboration acknowledges that theoretical benefits may not translate to practice, creating an interesting tension worth investigating.
For Q3, the elaboration connects to broader ergonomic concerns that are critical for real-world applications. By contrasting the physical movements required (finger movements vs larger wrist/arm movements), it highlights why understanding these differences matters for long-term usability and user acceptance. This makes the question interesting from both a research and practical perspective.
With these elaborations, readers can better understand the importance of the research investigations and gain more interest in reading experiment results.
In the overview, you can also include meta-level explanations that help frame how readers should interpret the rest of your study design. This is particularly important when you're following established methodological frameworks or making key design decisions that might otherwise raise questions later. For example, you might write: "We adopt the standard 'subtraction method' [refs] protocol to VR." followed by an elaboration: "This determines the precise cost of mode-switching by subtracting the time to perform tasks using a single mode from those when alternating between two modes." By placing such meta-level explanations in the overview, you preemptively address potential methodological questions and help readers understand the rationale behind your experimental choices. This is especially valuable when your approach builds on established practices in the field, as it demonstrates methodological rigor while ensuring readers have the necessary context to follow your subsequent detailed descriptions of procedures and analyses.
Participants When writing the participants section, follow this template:
- State the number and key demographics of participants: "[N] participants ([X] women, [Y] men) ranging in age from [min] to [max] years (mean=[avg] years) participated in the study."
- Describe recruitment source and any compensation: "Participants were recruited from [source] and [received compensation/volunteered] for the experiment."
- Note relevant experience or expertise: "Participants had [level] experience with [relevant technology/domain]."
- Explain why these participants are appropriate: "We recruited from [source] because [justification]."
For example, in a study comparing marking menu techniques: "Twelve right-handed participants (4 women, 8 men) ranging in age from 20 to 35 years were recruited from within the university community and volunteered for the experiment. None had previous experience with marking menus. University students and staff were appropriate participants as they represent potential users of marking menu interfaces and their lack of prior experience with marking menus allowed us to evaluate learnability and initial performance without bias from existing expertise. Right-handed participants were selected to control for potential handedness effects, though the techniques are expected to work similarly for left-handed users."
The key is to not just state participant demographics, but to explicitly justify why those participants are suitable for evaluating your research questions. Consider:
- Do they represent the target user population?
- Is their expertise level appropriate for what you're testing?
- Are there any characteristics that could affect results (e.g., handedness)?
- Are there any notable inclusion/exclusion criteria?
Providing this rationale helps readers evaluate the validity and generalizability of your results.
Apparatus The apparatus section should provide sufficient detail to allow others to replicate your experiment setup. Include:
- Hardware specifications:
- Computing platform (e.g., processor, memory, operating system)
- Input/output devices with key specifications (e.g., display size/resolution, input device dimensions)
- Any custom hardware or modifications
- Software details:
- Programming language and version
- Key libraries or frameworks used
- Any custom software developed
- Important implementation details that could affect results
- Physical setup:
- Spatial arrangement of equipment
- Environmental conditions (e.g., lighting, noise control)
- Any physical constraints or modifications (e.g., input area restrictions)
For example, in a marking menu study: "The experiment was conducted on a Pentium4 2Ghz workstation running Windows 10, with a 24" 4K display. Input was captured using a 12" x 18" Wacom Intuos Pro tablet with pen input in absolute mode. The usable tablet area was constrained using physical guides to test different input sizes. All software was implemented in Python 3.8 using PyQt5 for the interface. The tablet was positioned flat on the desk in front of the display, with participants seated approximately 50cm from the screen. Lighting was controlled to minimize screen glare."
When describing custom implementations of established techniques, note any deviations from previous work that could affect results. Consider including diagrams or photos of the setup if the arrangement is complex or novel.
Task and Stimuli The Task and Stimuli section should clearly describe what participants were asked to do and what they interacted with during the study. This section needs to cover three main aspects: the core task design, the stimuli presented, and the trial structure.
When describing the core task, explain what participants needed to accomplish, including any specific requirements or constraints they faced. Detail any practice or training provided to help them learn the task. For the stimuli, describe what was presented to participants, how these materials were designed or selected, and any variations or conditions used.
It's helpful to walk readers through a typical trial, explaining the sequence of events, timing, transitions, and feedback provided. This gives readers a clear understanding of the participant experience.
For example, in the marking menu study by Zhao & Balakrishnan ( Zhao & Balakrishnan, 2004 )
, the researchers needed participants to perform expert-level menu selections without extensive training. To accomplish this, they used familiar compass directions (N, S, E, W) as menu items rather than arbitrary labels. They supported learning through visual aids like a compass layout reference and included warm-up trials to familiarize participants with the interaction.
Each trial in their study followed a consistent sequence: The participant would first move their cursor to a start position marked by a circle. After dwelling there for 0.5 seconds, a selection instruction would appear (such as "Select N-W"). The participant would then make their required marks, receiving immediate feedback through color-coding (blue for correct, grey for incorrect) and visible mark trails. A simple tap would initiate the next trial.
The interface design integrated several key elements to support the task. A central input area matched the tablet constraints, with a clear start position circle and menu layout reference. The screen displayed relevant instructions and trial information, along with visual feedback elements to help participants understand their performance.
This carefully structured approach helped participants quickly learn the interaction techniques while still allowing rigorous testing of the core research questions. When writing this section, ensure you provide sufficient detail for replication, explain your rationale for task and stimuli choices, note any simplifications made, and describe the feedback mechanisms used. Including relevant screenshots or diagrams can help readers better understand complex setups or interactions.
When describing complex tasks or novel interaction techniques, it's crucial to supplement textual descriptions with visual aids. A video demonstration can be particularly effective, as it shows the exact flow of interaction, timing, and feedback that participants experienced. This helps readers better understand your experimental setup and makes your work more reproducible.
If a video is not feasible, include clear illustrations or screenshots showing:
- The initial setup and starting positions
- Key stages of task progression
- Visual feedback provided to participants
- Important interface elements and their arrangement
- Any physical setup or equipment configuration
Remember that while detailed textual descriptions are necessary, a single clear visualization can often communicate complex spatial or temporal relationships more effectively than several paragraphs of text. Consider what aspects of your task would be clearest through visual demonstration and plan your documentation accordingly.
Design and Procedure
The Design and Procedure section should comprehensively describe how your experiment is structured and conducted. This section needs to cover several key aspects of your experimental methodology.
First, clearly describe and justify your study design approach — whether within-subjects, between-subjects, or mixed design. Within-subjects designs are particularly common in HCI studies as they effectively control for individual differences and require fewer participants, though potential learning effects need to be carefully managed through counterbalancing and practice trials.
Your independent and dependent variables need to be thoroughly detailed. Independent variables are the factors you systematically manipulate in your study, such as interface techniques, difficulty levels, or environmental conditions. Dependent variables are your outcome measures, like completion time, error rate, or user preference ratings. For each variable, provide:
- A clear operational definition
- The specific levels or conditions being tested
- Rationale for the chosen values or ranges
Address how you control for potential confounding variables and ordering effects through:
- Counterbalancing or randomization strategies
- Practice sessions and warm-up trials
- Environmental controls
- Participant screening criteria
For example, in a vibration notification study ( Saket et al., 2013 ) , they employed a within-subjects design where participants evaluated 10 distinct vibration patterns. Pattern presentation was randomized to control for ordering effects. They included practice trials for each pattern and controlled the environment by having participants wear noise-canceling headphones to mask vibration sounds.
Conclude with a clear quantitative summary of your complete experimental design, including:
- Number of participants
- Number of conditions/levels for each independent variable
- Number of trials per condition
- Total number of trials
- Expected duration per participant
The marking menu study by Zhao & Balakrishnan illustrates how these elements come together effectively:
They used a within-participants design to compare compound versus simple mark techniques, enabling direct comparison while controlling for individual differences. Participants were randomly assigned to two groups - one starting with compound marks, the other with simple marks — to handle ordering effects. The study included three input space sizes (large, medium, small), fully counterbalanced across participants using all six possible orderings. Menu layouts were presented in fixed order of increasing complexity (compass4-2, compass4-3, compass8-2, compass8-3) to support progressive learning. Their complete design encompassed: 12 participants × 2 techniques (compound vs. simple marks) × 3 sizes (large, medium, small) × 128 menu items total: - 16 items in compass4-2 layout - 16 items in compass4-3 layout- 32 items in compass8-2 layout - 64 items in compass8-3 layout = 9,216 total selections
When pilot studies are conducted to refine the experimental design, document key findings that shaped the final protocol. Include pilot study details in the Methods section, after describing the main study design but before procedure details. The level of detail should reflect how significantly the pilot findings influenced the final design.
The vibration notification study by Saket et al. demonstrates effective pilot study documentation:
"We conducted two pilot studies to refine our experimental protocol. The first pilot with 6 participants (aged 21-25) focused on audio masking and signal timing. Through systematic testing of different noise types and signal lengths, we found pink noise was more effective than Brownian noise for masking motor sounds, and validated 200ms/600ms as appropriate short/long signal lengths. The second pilot with 4 participants tested pattern complexity, revealing that while users could distinguish 10 unique patterns, those with 3+ signal pairs were too difficult to reliably differentiate. This led us to limit patterns to 1-2 signal pairs in the main study."
Document pilot findings that:
- Determined critical parameters used in the main study
- Led to significant changes in the experimental design
- Would help other researchers replicate or build upon the work
Include specific numbers, measurements, and participant counts when these details influenced your final protocol. This transparency helps readers understand and evaluate your methodological decisions.
Dependent Measures
Your study should clearly document both objective and subjective measures used to evaluate the experimental conditions. For each measure, provide a clear description of what is being measured, the measurement instrument or method used, justification for choosing that measure, and any validation or reliability information for established measures.
A comprehensive evaluation requires carefully selecting multiple complementary measures that examine different aspects of system performance and user experience. Objective measures provide quantifiable data about system performance and user behavior, while subjective measures capture users' perceptions, preferences and experiences. Using both types of measures helps build a more complete understanding of the system being evaluated.
When selecting measures, researchers should prioritize established, validated instruments that have demonstrated reliability and validity in prior work. For example, the VITA study used the Cohen-Mansfield Observational Measure of Engagement (OME), a well-validated scale for measuring engagement in people with dementia. The researchers justified this choice by noting the OME's established track record in similar contexts and its ability to quantify engagement through observable behaviors rather than self-reporting.
For objective measures, researchers must clearly define how each metric is operationalized and measured. The marking menu study by Zhao & Balakrishnan provides a good example — they precisely defined their timing measures by breaking down menu selection into reaction time (from stimulus appearance to when drawing begins), drawing time (from drawing start to selection completion), and total time (sum of reaction and drawing times). They also carefully measured accuracy as the percentage of selections matching the stimulus, and quantified physical space usage through bounding box measurements. For each measure, they documented their data collection process and analysis methods, including how they handled outliers and validated that participants reached expert performance levels through analysis of learning effects.
Subjective measures often focus on user experience, system usability, and user satisfaction. The System Usability Scale (SUS) is a prime example of a validated instrument widely used in HCI research. When developing custom questionnaires, items should be carefully grouped to assess different aspects of the user experience. For instance, the VITA study included separate sections for evaluating the system's ease of use, the usefulness of specific features, and overall satisfaction with the volunteer experience. Researchers should document how individual item scores are aggregated into final metrics and justify any modifications made to established scales.
For special populations who cannot directly self-report, behavioral observation scales provide an alternative approach. The VITA study demonstrated this effectively by using the Cohen-Mansfield Observational Measure of Engagement (OME) to assess engagement through observable behaviors like attention span, attitude, and activity participation. To ensure objective and reliable measurements, the researchers implemented a rigorous observer training process where research assistants first practiced coding on 15-minute sample videos, followed by detailed feedback discussions on their coding choices. The researchers then validated the measurement approach by having two trained research assistants independently code the client-volunteer interaction videos. They assessed inter-rater reliability using Cohen's kappa coefficient, which showed high agreement between the coders (κ = 0.82, p < 0.01). This level of agreement was consistent with previously reported OME reliability values in the literature, giving confidence in the validity of their observational measurements. The final engagement scores were calculated by averaging the two coders' independent ratings, providing a robust quantitative measure of client engagement despite the inability to collect direct self-reports.
In summary, when documenting measures for your HCI study, it is critical to establish a comprehensive set of measures that directly map to your research questions and hypotheses. Your measures should provide multiple complementary perspectives through both objective and subjective data.
For each measure, you must clearly define what is being measured and how it operationally maps to your research questions. The precise measurement method needs to be thoroughly documented, including any tools, instruments or observation protocols used. You should justify why each specific measure was selected and how it helps evaluate your hypotheses. When using established measures, cite validation evidence from prior work. For custom measures, document your reliability testing and validation steps. The data collection procedures should be explained in detail, including any observer training if applicable. Finally, detail how raw measurements are processed into final metrics.
The goal is to provide enough methodological detail that other researchers could replicate your measurement approach. Being thorough and transparent about measurement helps readers evaluate the validity of your findings and builds confidence in your results. Well-documented measures also make it easier for future work to build upon and extend your research contributions.
Results Section
The results section requires systematic organization and clear presentation of your findings. Begin with a description of your analysis approach, followed by a methodical presentation of the data.
Start by explaining any preprocessing steps performed on the data, including data cleaning procedures, handling of outliers, and any transformations applied. Document the statistical tests used and any corrections applied, for example: "We conducted repeated measures ANOVA with Greenhouse-Geisser corrections when sphericity was violated."
Present your findings systematically, starting with main effects followed by detailed analyses. Use clear subheadings to organize different types of results. When reporting statistical analyses, include all relevant statistical information in APA format. For example:
"A one-way repeated measures ANOVA revealed a significant main effect of interface type on task completion time, F(2, 46) = 8.34, p = .002, ηp2 = .27, indicating that the type of interface significantly affected how quickly participants could complete tasks."
"Follow-up pairwise t-tests with Bonferroni correction showed that Interface A (M = 34.5s, SD = 8.2) led to significantly faster completion times compared to both Interface B (M = 45.3s, SD = 9.1), t(24) = 4.12, p = .003, d = 0.78, and Interface C (M = 48.7s, SD = 10.2), t(24) = 5.23, p < .001, d = 0.92, suggesting that Interface A's design was more efficient for users."
While the Results section should avoid extensive interpretation or discussion of implications, it is important to note that some level of explanation is necessary to help readers understand what the results mean. When reporting statistical findings, include brief statements that clarify what the numbers indicate about the data.
For example, rather than just stating "t(24) = 4.12, p = .003", you might write: "The analysis revealed significantly higher attractiveness ratings for Interface A compared to Interface B, t(24) = 4.12, p = .003, indicating that participants found the minimalist design more visually appealing."
These brief explanatory statements help readers follow your results narrative and understand the meaning behind the statistics. However, save deeper interpretation, theoretical implications, and connections to prior work for the Discussion section. The goal is to strike a balance between helping readers understand what the results show while avoiding extensive interpretation or speculation about broader implications.
For data visualization, choose either graphs or tables to present each set of data — never both for the same information. Ensure all visualizations have descriptive titles, clearly labeled axes, and error bars showing confidence intervals where appropriate. Reference each visual element explicitly in the text. Format tables according to APA guidelines and edit graphs to include only essential information.
The text should provide enough detail that readers could understand your results even without the visualizations. Focus on presenting results systematically without discussing their implications, which belongs in the discussion section. Begin with broad findings and move to more specific analyses, maintaining a logical flow throughout.
Document any learning effects analyses conducted to validate your experimental design. For example: "Analysis of performance across blocks showed no significant interactions involving block number, indicating minimal learning effects." This helps establish the reliability of your results.
Avoiding Result Overload
While thorough reporting of statistical results is important, be mindful not to overwhelm readers with an exhaustive list of every analysis performed. A common pitfall, especially for new researchers, is to report every statistical test and dependent variable without crafting a clear narrative. This can make the Results section tedious and difficult to follow.
Instead of writing: "We found a main effect of interface type (F(2,46) = 8.34, p = .002). We also found a main effect of task difficulty (F(1,23) = 12.45, p < .001). Pairwise t-tests showed differences between Interface A and B (t(24) = 4.12, p = .003), Interface A and C (t(24) = 5.23, p < .001)..." and continuing with similar statistical reporting for multiple other variables.
Consider organizing results thematically: "Interface Performance: Analysis revealed that interface type significantly impacted user performance (F(2,46) = 8.34, p = .002). Interface A consistently outperformed the alternatives, with 25% faster task completion times compared to Interface B and 30% faster compared to Interface C.
User Experience: Participants strongly preferred Interface A, rating it significantly higher on ease of use and satisfaction (detailed statistics in Table 1). This aligns with the performance data, suggesting that Interface A's design successfully balanced efficiency with user comfort."
Focus on presenting the most important findings that directly address your research questions. Consider moving secondary analyses to supplementary materials or appendices. Structure your results to tell a coherent story, using clear subheadings and transitions to guide readers through your findings. Remember that while statistical rigor is crucial, the goal is to communicate your findings effectively, not to document every analysis performed.
For more detailed guidance on writing experimental design and results sections, I highly recommend reading Andy Field's chapter on writing lab reports in "Discovering Statistics Using SPSS" (Field, 2017). The chapter provides excellent examples and detailed explanations of how to systematically present statistical analyses and results in a clear, professional manner.
Discussion Section
Here's a synthesis of how to approach these sections, inspired by best practices as recommended by McCombes and Scribbr :
Interpret the Results
: Start the discussion by interpreting your findings in the context of the hypotheses and research questions you presented earlier.
Example Guide
: "The reduction in task completion time supports our hypothesis that gesture-based controls enhance navigation efficiency in a virtual environment."
-
Discuss Implications
: Explore the implications of your results for the field of HCI. How do your findings impact current understanding or practice?
Example Guide : "These results suggest that incorporating gesture-based controls could improve user interaction with virtual environments, aligning with the trend towards more intuitive HCI methods." -
Acknowledge Limitations
: Be transparent about any limitations in your study that may affect the validity or generalizability of your results.
Example Guide : "The study's limitations include a small sample size and a single virtual environment, which may limit the generalizability of the findings." -
Suggest Further Research
: Identify areas where additional research is needed. What questions remain unanswered, and what could be investigated next?
Example Guide : "Further research should explore a variety of virtual environments and include a larger, more diverse sample to confirm these findings." -
Compare with Existing Literature
: Position your results within the existing body of research. Do they confirm, extend, or challenge previous studies?
Example Guide : "Our findings extend the work of Smith et al. (2020) by demonstrating efficiency gains not only in task completion but also in user-reported satisfaction." -
Conclude Your Section
: End with a strong conclusion that summarizes the main findings and their relevance.
Example Guide : "In conclusion, our study indicates that gesture-based controls can significantly enhance the efficiency of virtual navigation, marking a promising direction for HCI research."
Remember, while the Results section is about presenting data, the Discussion section is about making sense of that data. Together, they tell the story of your research's contribution to the field of HCI.
9.1.6 Subsequent Studies
If your research includes additional studies, apply the same process for each one. A paper will typically include two to three studies, though there can be exceptions.
Example: A second study might investigate the accuracy of the predictive text input system. If the first study established speed, the second could explore whether users make more or fewer errors when using the new system.
9.1.7 Implementation Section
After you have conclusive results, it's time to describe the implementation details. This ensures that any last-minute changes based on your study outcomes are accurately reflected.
The important rules of the writing implementation section is 1) replicability. Enough details should be provided so that a good graduate student can possibly replicate the implementation. 2) length. The CHI community places greater emphasis on interaction design and user experience than implementation details, particularly when the technical complexity could detract from communicating the core HCI contributions. A very long implementation section can be really boring to read, so definitely control the length of this section. Typically maximum 2 pages. Sometimes, even half of a page might be enough. Depending on how much space you have, decide on how much details you want to include in your implementation section. If part of your contribution is technical, and you have novelty elements in the implementation, then more details should be included. If the implementation does not contain much novelty, then it can be brief. When including an implementation section, it’s important to use sub-headings, figures to structure the content, so that people can skip sections if they are not interested in, or just glance through the figure to get a basic understanding of the process.
- Learn from Examples : Looking at some concrete examples from published HCI system papers: Vignette used a little more than 1 page to detail their texture synthesis algorithms, while VITA used 1.5 pages to explain their profile, activity kit, and activity guidance system. SandCanvas took a slightly different approach — it used 2.5 pages to describe both implementation (sand simulation and gesture mapping techniques) and interface design/interactions together. If focusing only on the core implementation details, SandCanvas's technical section would be around 1.5 pages.
- Open Source Your Code : Making your code open source and providing a repository link can significantly reduce the need for detailed implementation descriptions. When reviewers can verify that the code works and examine all implementation details directly, they are less likely to question specific technical aspects in the paper. A simple statement like: "The complete source code is available at [repository URL] under an MIT license" can give reviewers confidence while saving valuable paper space.
- Include Implementation Insights : Share key technical challenges encountered and how they were solved, particularly if these insights could benefit other researchers.
Remember: The goal is to provide sufficient technical depth to establish credibility and reproducibility while maintaining focus on interaction innovations that advance HCI knowledge.
9.1.8 Literature Review and Introduction
Your literature review and introduction should be written once you have a firm grasp of your paper's results and how they contribute to the field. This section frames your research within the existing body of knowledge.
9.1.8.1 How to write the related work section
Overall pattern for writing literature review
In related work, you will convince the readers that your work is original and different from previous research .
•
Pattern:
• (Optional) Background
• Overview of the subtopics (typically, the order of the sub-topics is from broad to narrow, loosely related to the most related), and why these subtopics are related to your current research • Subtopic 1 • Transition • Elaboration • Gap • Subtopic 2 • Transition • Elaboration • Gap • Subtopic 3 • Transition • Elaboration • Gap • Overall summary (talk about the connection to the related work, and why our work is unique and important). Sometimes, it is ok to not have the overall summary, if the individual subsections are already clear about the differences.
Writing overview of subtopics
Provide an explanation/definition of your work topic. In this explanation/definition, you define what's related, what's not related, and why . Note that many topics and areas may seem related. It's up to you to define what your readers should care about and not care about. Typically, this explanation/definition naturally provides a guide on what subsections you will review in your related work section.
Example 1
This example come from the Bubble Cursor paper ( Grossman & Balakrishnan , 2005 ) , which provides an excellent example of how to structure a related work section. Let's analyze how they organized their literature review . The actual text from the paper:
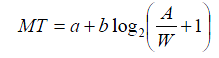
The common approach for studying new selection techniques is to use Fitts' law [6, 11], a highly successful model for predicting movement time in a pointing task. Fitts' Law states that the time (MT) to acquire a target with width W and distance (or amplitude) A from the cursor can be predicted by the equation: where a and b are empirically determined constants. The logarithmic term is the index of difficulty (ID) of the task. It can be seen from Fitts' Law that if a target's size decreases, or the distance needed to travel to acquire the given target increases, then the time taken to select it increases. Thus target selection can be facilitated by increasing the target width [5, 9, 14, 15, 17], decreasing the amplitude [3, 8], or both [4]. We now review such selection techniques.
Why This is Well-Written:
- Problem Space Definition : The section begins by clearly defining the problem space around target selection techniques through Fitts' law.
- Elegant Categorization : Using the Fitts' law formula, the authors naturally categorize prior work into three complete categories:
- Increasing target width
- Decreasing amplitude
- Combining both approaches
- Vocabulary Introduction : Key technical terms like "width", "amplitude", and "index of difficulty" are defined within the explanation.
- Clear Roadmap : The final sentence acts as a signpost, indicating how the subsequent subsections will be organized around these categories.
Example 2
This example come from the Magic Cards Paper ( Zhao et al., 2009 ), this example shows how to handle cases where there isn't a clear theoretical framework to organize the literature review. Instead of forcing an artificial structure, the authors simply acknowledge the key relevant areas that influenced their work.
| Both conceptually and technologically, our approach was inspired by the vision and practices of several fields in Human Computer Interaction (HCI), including "Ubiquitous Computing" [28], "Augmented Reality" (e.g., [5, 13, 19]), Tangible User Interface (TUIs) [12], and various work on paper-based interfaces [10, 13, 20, 23, 29]. |
Why This is Well-Written:
- The work draws from multiple disparate areas
- There isn't a clear theoretical framework to organize the literature
- You want to quickly acknowledge influences without deep analysis
Example 3
| SandCanvas ( Kazi et al., 2011 ) is inspired by new media interactive installations and recent advances in interactive surfaces. [This opening sentence introduces the high-level context and inspiration for the work.] We divide related work into three sections. First, we briefly summarize recent work in technologically enhanced static and performance art creation systems in general and for multi-touch surfaces. We then describe related systems and algorithms for sand motion simulation. Finally, we discuss systems closely related to SandCanvas. [This paragraph provides a clear roadmap of how the literature review will be organized into three logical categories that build from general context to directly related work.] |
Example 4
Original text from MOGCLASS paper ( Zhou et al., 2011 ) :
| MOGCLASS combines three key important concepts: mobile devices, music-making, and classroom music education. Previous work exists when combining two of the three concepts (such as mobile devices + music-making; mobile devices + education). However, MOGCLASS is the first system to combine all three elements. Relevant literature is reviewed in the following three sections: 1) music-making with mobile devices 2) using mobile devices to enhance education 3) technology-enhanced music education. |
Analysis of why this is well-written:
- Clearly defines the three key concepts that make up MOGCLASS
- Explains how prior work only combines two concepts at a time
- Establishes novelty by being first to combine all three
- Provides logical organization for literature review based on pairwise combinations
- Uses the natural structure of combining any 2 from 3 concepts (A,B,C) to yield three sections (AB, BC, CA)
- Sets up clear differentiation from prior work early, though details come later
Writing the body of related work
Writing pattern
Pattern Detailed explanation:
• Transition: Introduce the sub-topic or work being discussed
• Explanation: Describe the key details and contributions
• Gap: Identify limitations or areas for improvement
In a well-defined sub-topic, it may have one, several, or many related papers. Below are examples of each of them.
Discussing one piece of work
| On one piece of work: An interesting attempt to directly reduce A is the drag-and pop technique developed by Baudisch et al. [3]. [This sentence transitions by introducing the technique.] In this technique, the system analyzes the directional movements of the cursor and temporarily brings virtual proxies of the potential targets towards the cursor. [This explains how the technique works.] While this technique was found to be beneficial on a large display for very large A, it can be tricky to determine when the user intends to select the remote elements versus items that are in the nearby vicinity. Falsely activated proxies may annoy or even impede the user's selections. As a result, this technique tends to work best in an environment with a relatively sparse layout of targets. [This identifies limitations and gaps in the approach.] |
Discussing several pieces of work
|
Instead of enlarging the cursor's activation zone to increase effective target width, the size of the actual target can be increased. [Transitional sentence: introducing the sub-topic you are reviewing. You can then elaborate the works within this topic] McGuffin and Balakrishnan [14] investigated the potential performance benefits of expanding targets, whose size dynamically increases as the cursors approach. They found that users were able to take advantage of the larger expanded target width even when expansion occurred after 90% of the distance to the target was traveled. It was also shown that overall performance could be modeled accurately by Fitts' law by setting W to the expanded target width. [One piece of work] Zhai et al. [17] followed up this study by showing that even when users could not anticipate the expansion, similar performance gains were realized. [Extension of previous work] Cockburn and Firth [5] developed a similar technique based on expanding targets called bubble targets. Instead of increasing the size of the entire target, a bubble would appear around the target as the cursor approached. [Present a similar work with the difference highlighted] While expanding targets improve selection times for single isolated targets [14, 17], to date it has not been shown to work well when multiple targets are present in close proximity [13, 14, 17]. [Gap: point out the limitations for all the works above] |
Discussing many pieces of work
| There have been a number of efforts to facilitate pointing by dynamically adjusting the control display (CD) gain. By increasing the gain while approaching a target, and decreasing it while inside a target, the motor space distance and width are decreased and increased respectively. Such adaptive CD gain techniques have been shown to decrease target acquisition times [4, 5, 10, 15] [This sentence discusses several related papers together that share a common approach.] In a variation called semantic pointing Blanch et al. [4] showed that performance could be predicted using Fitts' Law, based on the resulting larger W and smaller A in motor space. [This work is related but slightly different, so it is mentioned separately.] Once again, however, problems arise when multiple targets are present as the intervening targets will slow down the cursor as it travels to its destination target. [This identifies a key limitation that applies to this class of techniques.] |
Skipping a topic by briefly introducing it
Sometimes, there is an area which the reviewers will think about, but it’s actually not so related, yet, it’s such an important area that it's difficult to not mention it. You can approach this by mentioning it briefly and then tell people why you don’t want to focus on that.
The "Thematic Clustering" Pattern for Loosely Related Work
Sometimes, the research area is not well defined, with many loosely related pieces of work that connect to your research in different ways. In this case, you can selectively discuss the most relevant prior work by clustering them thematically. Use the following pattern:
Pattern
- Para 1: Some works did this (which is similar to our work)
- Para 2: Some works did that (which is similar to our work)
- Para 3: Some works did bla (which is similar to our work)
- ...
- However, we did bla, which is unique
Example
| Technologically Enhanced Art Creation Systems Performance art has a rich history that spans hundreds of years [15]. [transition and framing: introducing the subject of the paragraph] Myron Krueger's Videoplace, developed between 1969 and 1975, was an early interactive artwork that incorporated computer vision [13]. Since Videoplace, numerous audio-visual performance systems have been driven by human gestures [16, 25]. Examining numerous audio-visual performance systems, Levin derived a set of design goals for new performance art systems [16]. According to him, successful systems should be predictable, instantly knowable and indefinitely masterable. We pursued similar goals when designing SandCanvas. [this paragraph talks about audio visual performance systems. This is placed first because it has work that trace back to hundreds of years. The last sentence tell readers the relationship between SandCanvas and the work mentioned] In recent years, researchers have produced 2D animation by demonstration systems that could be used for performance art. [transition and introducing the main topic for this paragraph] K-Sketch [8] is a general purpose and informal sketch based 2D animation tool that allows novices to create animation quickly and easily, but all interaction must be done through a single point. In Video Puppetry [4], artists record simultaneous manipulations of multiple physical puppets to create animation. Researchers have also explored the use of multiple touch points to record real-time deformation of characters [11]. [elaboration on this topic] Researchers have also produced notable multi-touch painting systems . [transition and topic introduction] Project Gustav attempts to create a realistic painting experience [20], while I/O brush [23] allows artists to paint with colors, textures, and movements "picked up" from everyday materials. Fluid Paint [28] and IntuPaint [29] are notable because they use the entire region of contact between brush and surface to model brush strokes. [elaboration by providing examples] SandCanvas also captures the entire region of contact between the surface and the artist's hand to model interactions with sand. [draw relationship back to SandCanvas] SandCanvas bears a resemblance to each of the art creation systems presented here. It is a medium for performance art where the final performance is a kind of 2D animation. Instead of animating a fixed set of characters, however, the artist creates characters in sand using rich gestures that cannot be represented adequately with a set of discreet points. SandCanvas also has unique creative tools like recorded gestures that aren't found in any of these systems. [compare and contrast SandCanvas with work mentioned in this section] |
Writing overall summary
In the overall summary, you typically want to tell people why our approach is different and/or important.
Pattern
- First, discuss how your work relates to and builds upon previous research, highlighting the valuable aspects you've incorporated
- Then, clearly articulate the key differences and novel contributions that distinguish your work from prior approaches
Both examples below are from a paper about using paper cards to control robots for household tasks. The examples demonstrate different ways to summarize related work and position your research contribution within the broader literature.
Example 1
Here's an example of how to write an overall summary that highlights key differences from prior work:
| While various works have inspired us, our research is nevertheless different. Compared with traditional robot-centric HRI approaches, our interaction focuses on tasks. Instead of interacting with robots, we use paper cards to interact with tasks and objects. The complexity of robots and the system are hidden in the background. When compared with UbiComp, AR, and TUI, our research can be distinguished by using real-world artifacts to manipulate real-world objects and tasks. This is in contrast to the conventional approach of using specialized input devices (such as a mouse and keyboard) to manipulate objects in the virtual world (desktop computing), or using real-world environments or objects to augment or manipulate the digital world or digital objects (e.g., AR and TUI). Although the interaction regarding input in our approach is similar to both AR and TUI, the output or outcome of the system is different: instead of moving and manipulating bits and bytes, we move real objects using mobile robots. |
This example demonstrates several key elements of an effective summary:
- It clearly states upfront that the work is different from prior approaches
- It systematically compares with different research areas (HRI, UbiComp, AR, TUI)
- For each comparison, it highlights specific differentiating factors
- It acknowledges similarities where they exist while emphasizing key differences
Note: Sometimes you may want to mention background information that doesn't fit in the introduction. In such cases, you can incorporate it into the related work section, as shown in Example 2 below.
Example 2
| While our research lies in the area of HRI, our motivation was rooted in the fact that most of us spend significant amounts of time on housework. [introducing the research area and motivation] According to the National Survey of Families and Households, the average woman spends 28 hrs per week on housework while the average man spends 18 [2]. Excessive housework also has various objectionable effects [11, 17]. To most people, housework is still a tedious necessity rather than an enjoyable pastime [establishing the problem space with statistics and evidence] . The emergence of domestic service robots, such as the vacuum robot (Roomba) and other types of robots from iRobot ( www.iRobot.com ), points to a start in solving this problem in the future. [introducing existing technological solutions] Various studies in the HRI community focusing on Roomba and domestic service robots [7, 8, 25] have pointed out the potential of these robots as well as the challenges of introducing them into our homes. However, "homes are not simply designed to accommodate service-robot technologies, rather, domestic-service robots need to be designed to 'artfully integrate' with structures and practices of the home" [8, 27], which motivated the approach we took. [identifying limitations of current solutions and introducing our approach] Both conceptually and technologically, our approach was inspired by the vision and practices of several fields in Human Computer Interaction (HCI), including "Ubiquitous Computing" [28], "Augmented Reality" (e.g., [5, 13, 19]), Tangible User Interface (TUIs) [12], and various work on paper-based interfaces [10, 13, 20, 23, 29]. [connecting to broader research context and related work] |
9.1.8.2 How to write introduction
The introduction is the most important part of the article. As discussed earlier, we recommend writing it after completing your results and discussion sections. This allows you to craft a compelling narrative around your proven contributions - the ones backed by data and evidence. Once you have a crystal clear understanding of your work's value, you can develop the perfect story to effectively communicate these contributions to your target audience.
Introduction serves the following purposes:
- Tell people what problem you are working on and its significance (why should we care about it?)
- What has been done, and why this problem has not been solved
- The purpose of this paper and/or what you have done
- The contribution specific to your research community
This structure is sometimes called the CRGP structure
(
CRGP
) Context - Review - Gap - Purpose/Your work (+ Contribution)
Keep in mind the logical flow is from:
* General => Specific
* Known => Unknown
Sometimes it would take too long to provide a grand context, so don't bother "A major open problem in computational geometry is computing the bounding box of a penguin."
Managing expectations
Sell your work, but do not lie
- All claims should be supported with experiments, proofs, analysis, etc.
- Avoid grandiosity ("we propose a framework …")
- Unfulfilled promises are the kiss of death
State your assumptions
Make the
context
and
contribution clear
The reader should know precisely why the paper is worth reading (e.g., a paper with a geometry component and an HCI component might have novelty in only one of the two areas; make it clear what is novel)
Signal Words for Gap:
- Sentence connectors:
- however, nevertheless, yet, unfortunately, but
- Negative quantifiers:
- no, little, few, neither...nor
- Lexical negation:
- fail, lack, overlook, inconclusive, complex, misleading, elusive, scarce, limited, questionable, failure, limitation
- Negation in the verb phrase:
- not, rarely, ill
- Questions or problems:
- A question remains whether ...; A key problem in ... is ...
- Expressed needs/desires/interests:
- It is of interest to compare ...; It is desirable to perform test calculations ...
Now that we have covered the key principles of writing introductions, let's examine some concrete examples that demonstrate different effective approaches.
Let's analyze our first example, which comes from "Designing Games with a Purpose" by Luis von Ahn and Laura Dabbish — a highly influential and exceptionally well-crafted paper ( Von Ahn & Dabbish, 2008 ) .
Example 1: Designing Games with a Purpose
| Many tasks are trivial for humans but continue to challenge even the most sophisticated computer programs. The problem - tasks are challenging for computers to do - and a bit of context: yet they are trivial for humans to perform. It is amazing how the author can express so much in such a short sentence! Traditional computational approaches to solving such problems focus on improving artificial intelligence algorithms. Existing approaches Here, we advocate a different approach: the constructive channeling of human brain power through computer games. Our alternative approach Toward this goal, we present general design principles for the development and evaluation of a class of games we call "games with a purpose," or GWAPs, in which people, as a side effect of playing, perform tasks computers are unable to perform. What this paper is about - design principles of GWAP - and further elaboration of what GWAP is. This first paragraph is super clear and concise. Notice that the author only used 4 sentences, but they are carefully crafted to express the main idea of the paper.
The Entertainment Software Association ( www.theesa.com/facts/gamer_data.php ) has reported that more than 200 million hours are spent each day playing computer and video games in the U.S. Indeed, by age 21, the average American has spent more than 10,000 hours playing such games [15]—equivalent to five years of working a full-time job 40 hours per week. The first paragraph explains what, now the author tries to explain why the alternative approach is significant, viable, worth investigating. First, people spend a lot of time on games. Notice the author used three ways to help explaining the data. 200 million hours each day (collectively a large number), 10,000 hours each person before the age of 21, individually a large number, equivalent to five years of working a full-time job, put in a different scale so that it is easy for us to understand. This is a technique we should learn from. What if this time and energy were also channeled toward solving computational problems and training AI algorithms? Ask a question to channel readers' thinking.
People playing GWAPs [22–25] perform basic tasks that cannot be automated. The ESP Game [22] a.k.a. the Google Image Labeler (images.google.com/imagelabeler/), is a GWAP in which people provide meaningful, accurate labels for images on the Web as a side effect of playing the game; for example, an image of a man and a dog is labeled "dog," "man," and "pet." The game is fast-paced, enjoyable, and competitive; as of July 2008, 200,000 players had contributed more than 50 million labels; try it yourself at www.gwap.com . These labels can be used to improve Web-based image search, which typically involves noisy information (such as filenames and adjacent text). Rather than using computer-vision techniques that do not work well enough, the ESP Game constructively channels its players to do the work of labeling images in a form of entertainment. Instead of arguing the approach is viable and significant. The author simply show you the effect. The stats tell the story, and if you don't believe it, here is a link for you to try. What can be more convincing than this?
Other GWAPs include Peekaboom [25] which locates objects within images (and has been played more than 500,000 human-hours); Phetch [23] which annotates images with descriptive paragraphs; and Verbosity [24] which collects common sense facts in order to train reasoning algorithms. In each, people play not because they are personally interested in solving an instance of a computational problem but because they wish to be entertained. Of course, it is not one case success - as people may think that's luck - there are at least 3 other games, so that's not luck, there must be some real insights behind the scene.
The ESP Game, introduced in 2003, and its successors represent the first seamless integration of game play and computation. How can this approach be generalized? Our experience building and testing GWAPs with hundreds of thousands of players has helped us spell out general guidelines for GWAP development. Indeed, we thought about it and try to come up with general guidelines Here, we articulate three GWAP game "templates" representing three general classes of games containing all the GWAPs we've created to date. The magic number of three. The secret include: 3 game templates They can be applied to any computational problem to construct a game that encourages players to solve problem instances. Each template defines the basic rules and winning conditions of a game in a way that is in the players' best interest to perform the intended computation. Elaboration of these templates We also describe a set of design principles that complement the basic game templates. And we also have a set of principles that's general to different templates While each template specifies the fundamental structure for a class of games, the general design principles make the games more enjoyable while improving the quality of the output produced by players. Explain the relationship between the templates and general design principles Finally, we propose a set of metrics defining GWAP success in terms of maximizing the utility obtained per human-hour spent playing the game. We also tell you how to measure success. Note that although this example follows the basic structure of "Context - Review - Gap - Purpose/Your work (+ Contribution)", it is done in a slightly different way. Its first paragraph already contain all the info, and it uses rest the intro to elaborate on why the alternative approach is significant, viable, and tell us the exact contribution extracted from the alternative approach. |
Example 2: Introducing concepts through an analogy (a different way of introduction)
| In human-to-human communication, asking for information about tangible objects can be naturally accomplished by making direct visual references to them. For example, to ask a tour guide to explain more about a painting, we would say "tell me more about this" while pointing to [mona lisa]. Giving verbal commands involving tangible objects can also be naturally accomplished by making similar visual references. For example, to instruct a mover to put a lamp on top of a nightstand, we would say "put this over there" while pointing to "lamp" and "nightstand" respectively.
Likewise, in human-to-computer communication, finding information or issuing commands involving GUI elements can be accomplished naturally by making direct visual reference to them. For example, asking the computer to "find information about this" while pointing to [Lasso icon], we would like the computer to tell us about the Lasso tool for Photoshop and hopefully even give us links to web pages explaining this tool in detail. Asking the computer to "move all these over there" while pointing to [word icon] and [recycle bin] respectively, means we would like the computer to move all the Word documents to the recycle bin.
However, some interfaces do not interact with us visually and force us to rely on non-visual alternatives. One example is search. With the explosion of information on the web, search engines are increasingly useful as a first resort for help with a GUI application, because the web may have fresher, more accurate, more abundant information than the built-in help. Searching the web currently requires coming up with the right keywords to describe an application's GUI elements, which can be challenging. Another example is automation. Scripts or macros that control GUI elements either refer to an element by name, which may be unfamiliar or even unavailable to the user, or by screen location, which may change.
This paper presents Sikuli, a visual approach to searching and automating GUI elements (Figure 1). Sikuli allows users or programmers to make direct visual reference to GUI elements. To search a documentation database about a GUI element, a user can draw a rectangle around it and take a screenshot as a query. Similarly, to automate interactions with a GUI element, a programmer can insert an element's screenshot directly into a script statement and specify what keyboard or mouse actions to invoke when this element is seen on the screen. Compared to the non-visual alternatives, taking screenshots is an intuitive way to specify a variety of GUI elements. Also, screenshots are universally accessible for all applications on all GUI platforms, since it is always possible to take a screenshot of a GUI element.
We make the following contributions in this paper:
- Sikuli Search, a system that enables users to search a large collection of online documentation about GUI elements using screenshots;
- An empirical demonstration of the system's ability to retrieve relevant information about a wide variety of dialog boxes, plus a user study showing that screenshots are faster than keywords for formulating queries about GUI elements;
- Sikuli Script, a scripting system that enables programmers to use screenshots of GUI elements to control them programmatically. The system incorporates a full-featured scripting language (Python) and an editor interface specifically designed for writing screenshot-based automation scripts;
- Two examples of how screenshot-based interactive techniques can improve other innovative interactive help systems (Stencils [8] and Graphstract [7]). |
Note: this paper's way of indicating context and gap is more implicit, it also does not provide a review, which may not always be ideal, but what's refreshing is the opening approach: using an analogy.
Having examined these examples in detail, let's address some common questions that arise when writing introductions. These questions and answers can help clarify specific aspects of introduction writing and common challenges you might face.
|
Question:
Answer:
You are not supposed to include too much background information in the paper. Background information should be limited to 1-2 paragraphs. If you found that your background information is more than 3 paragraphs, that means you are including too much information in the intro. Also, a paragraph should not be longer than 5 sentences. If you found your paragraph to be too long, you should also consider reducing it. |
|
Question: (for starters) Would be good to know how this is different from the related work section. Know which part of relevant literature is part of the intro and which part is part of related works. Answer: in the introduction, you only provide some general claims about what has been done. Typically this is accomplished in 1 to several sentences and maximumly one paragraph, so you don’t provide much detail here. You will elaborate on what has been done and why it is not solved in your related work section. |
|
Question: is there a way to check whether we have answered our RQ well enough? Answer: This is difficult to describe with the exact steps to follow. Typically, you can check other people’s claims easily if they have evidence to support their claims. One useful activity is to check every claim you are making and try to list down the evidence/analysis you provided, and see whether or not they appear sufficient. It might be useful to make a table for it so that you can concentrate on the claims and not be distracted by other text in the paper. |
Additional tips
Here are some additional tips for writing your paper effectively.
- Use Q&A Style Storytelling: Structure your presentation around a compelling question. Before presenting your study, raise the question that motivated your research.
Then, after presenting your findings, provide a clear and concise answer to the question. This storytelling approach helps create a narrative arc and keeps the audience engaged throughout the presentation
- Incorporate Video Demonstrations: For artifact/constructive contributions, including a video demonstration is highly recommended. A video can effectively showcase the functionality and features of your artifact, making it easier for reviewers and readers to understand your work. Plan in advance what you want to demonstrate in the video and ensure it highlights the key aspects of your artifact.
- Document Design Process and Evaluation: Throughout your research journey, make sure to record your design process, implementation stages, and the evaluation process in photos and videos. These visual records can serve as valuable and convincing evidence in your video presentation. They provide a deeper understanding of the development and evaluation of your artifact.
Summary
Writing an HCI research paper is a complex but manageable process when approached systematically. As we've discussed in this chapter, following a strategic order of writing can help streamline the process and ensure coherence in your final paper. The recommended sequence (Abstract → Outline → Design Space → Methods → Results → Implementation → Literature Review/Introduction) allows you to build your paper organically, letting your findings guide the narrative.
The outline phase is particularly crucial as it serves as your research roadmap. For empirical research, it helps structure your experimental workflow, ensuring each study builds upon previous findings. For constructive research, it helps organize your design iterations and evaluation phases. A well-crafted outline also makes it easier to maintain focus on your research contributions while writing.
In today's era of AI and large language models, the nature of academic writing is evolving. While AI tools can assist with lower-level tasks like word choice and sentence structure, the higher-level skills of clear thinking and strategic planning become even more critical. The ability to provide clear, well-structured instructions to AI writing assistants requires a deep understanding of your research narrative and contributions. This skill - breaking down complex ideas into clear, logical components - needs cultivation through practice and experience.
Remember that writing is an iterative process. Your first draft won't be perfect, and that's okay. Use the structure provided in this chapter as a framework, but be flexible enough to adapt it to your specific research context. Get feedback early and often, and don't hesitate to revise your outline as your research evolves.
Whether you're working on your first paper or your fifteenth, we hope this chapter has provided you with practical strategies to make your writing journey more manageable and productive. Remember, every researcher has faced similar challenges, and with proper planning and systematic execution, you can effectively communicate your valuable contributions to the HCI community.
References
Ram, A., & Zhao, S. (2021). Lsvp: Towards effective on-the-go video learning using optical
head-mounted displays. Proceedings of the ACM on Interactive, Mobile, Wearable and Ubiquitous
Technologies, 5(1), 1-27.
Rayner, K. (1998). Eye movements in reading and information processing: 20 years of research.
Psychological bulletin, 124(3), 372.
Zhao, S., & Balakrishnan, R. (2004, October). Simple vs. compound mark hierarchical marking
menus. In Proceedings of the 17th annual ACM symposium on User interface software and
technology (pp. 33-42).
Saket, B., Prasojo, C., Huang, Y., & Zhao, S. (2013, February). Designing an effective vibration-based
notification interface for mobile phones. In Proceedings of the 2013 conference on Computer
supported cooperative work (pp. 149-1504).
Grossman, T., & Balakrishnan, R. (2005, April). The bubble cursor: enhancing target acquisition by
dynamic resizing of the cursor's activation area. In Proceedings of the SIGCHI conference on
Human factors in computing systems (pp. 281-290).
Zhao, S., Nakamura, K., Ishii, K., & Igarashi, T. (2009, April). Magic cards: a paper tag interface for
implicit robot control. In Proceedings of the SIGCHI Conference on Human Factors in Computing
Systems (pp. 173-182).
Kazi, R. H., Chua, K. C., Zhao, S., Davis, R., & Low, K. L. (2011, May). SandCanvas: A multi-touch
art medium inspired by sand animation. In Proceedings of the SIGCHI Conference on Human
Factors in Computing Systems (pp. 1283-1292).
Zhou, Y., Percival, G., Wang, X., Wang, Y., & Zhao, S. (2011, May). MOGCLASS: evaluation of a
collaborative system of mobile devices for classroom music education of young children. In
proceedings of the SIGCHI Conference on Human Factors in Computing Systems (pp. 523-532).
Von Ahn, L., & Dabbish, L. (2008). Designing games with a purpose. Communications of the ACM,
51(8), 58-67.